Market Sense: Economic and Market Research
By:


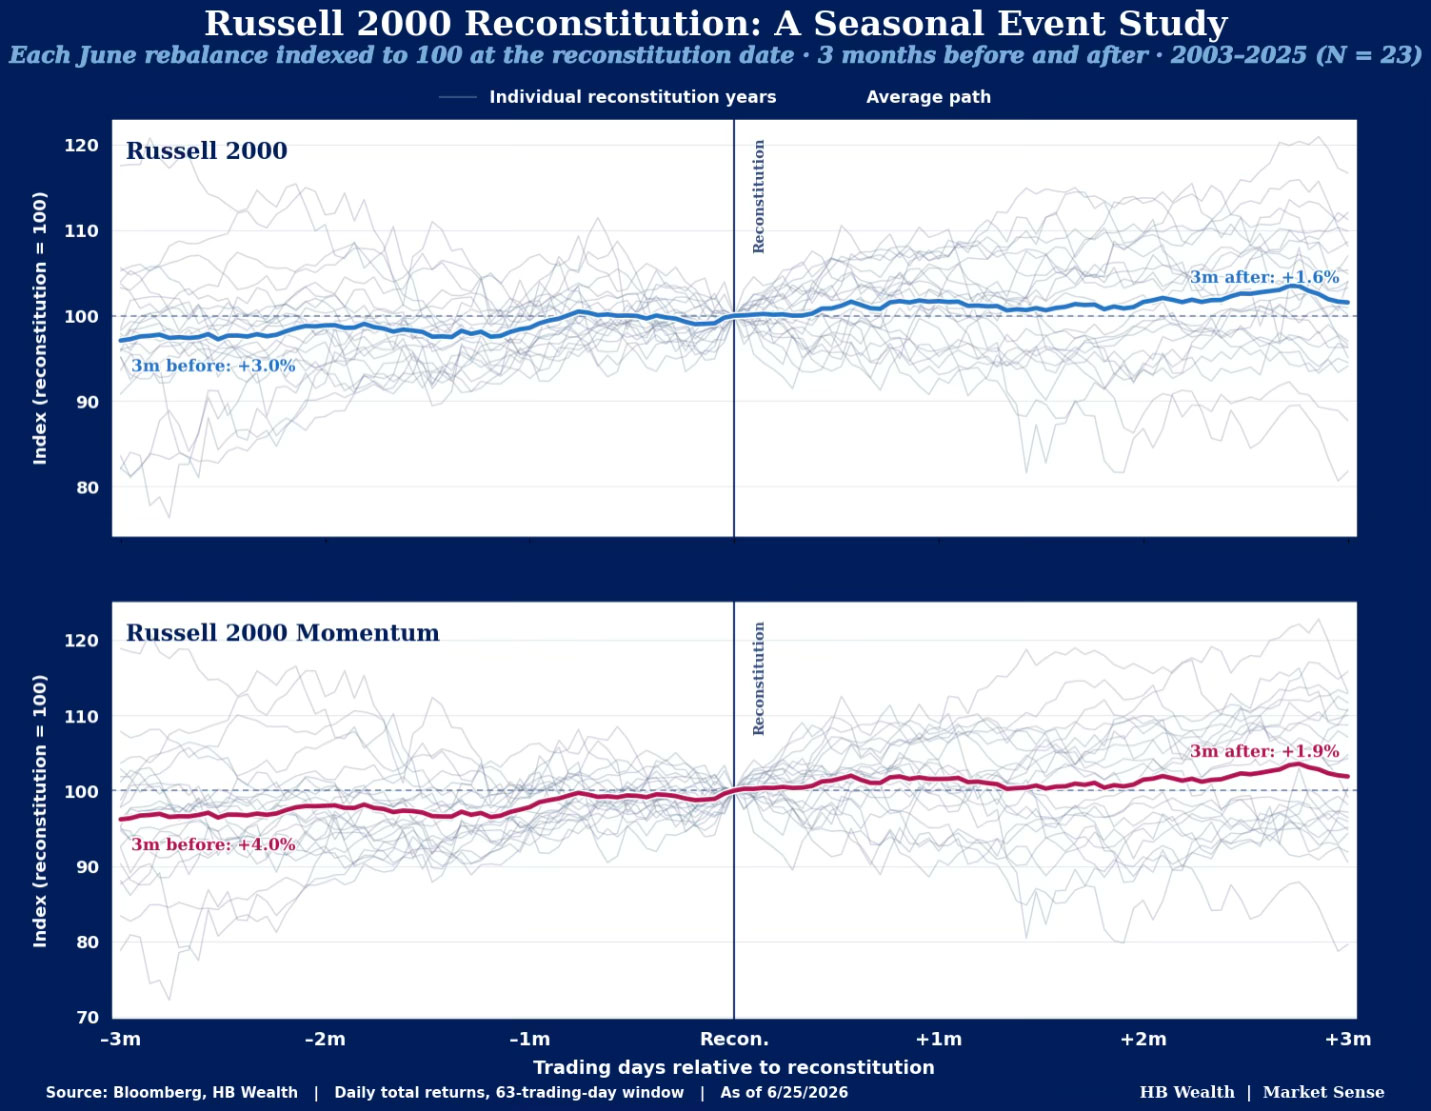
Abstract: Russell’s now semiannual reconstitution will take effect on June 29th and the event looks poised to contribute some volatility to the index this summer as changes take hold. SpaceX will grab all the headlines, officially entering the Russell 1000 after Friday’s close but the real story may be how…
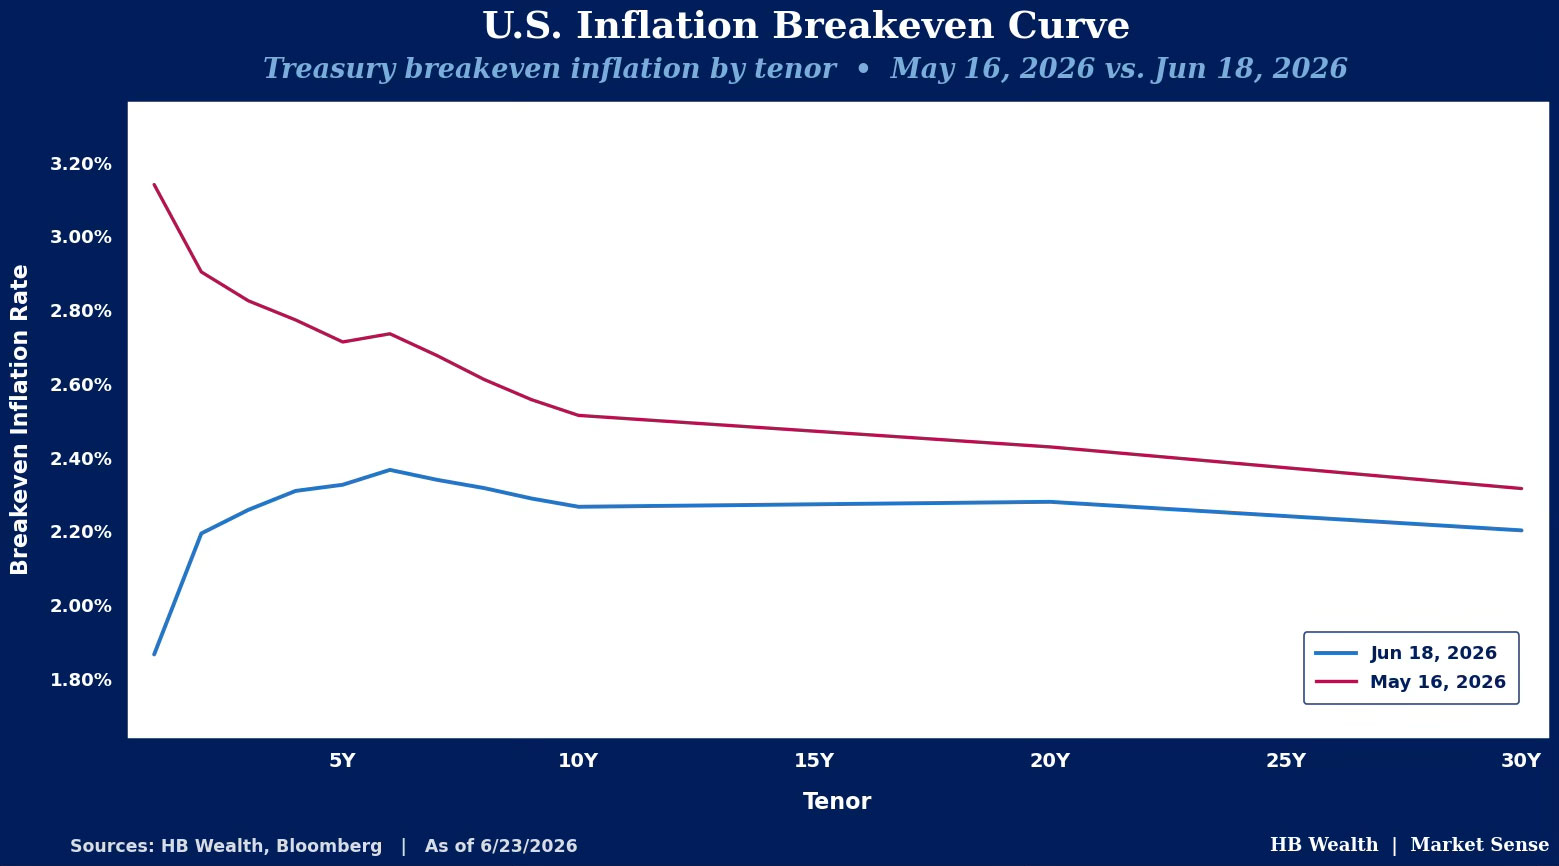
Abstract: Oil is down almost 30% over the past month, and inflation breakevens have fallen right along with it. Yet, Fed Funds futures have only moved in the direction of future hikes. If inflation expectations are dropping, some may ask why rate-cut expectations are not dropping as well. The reason…
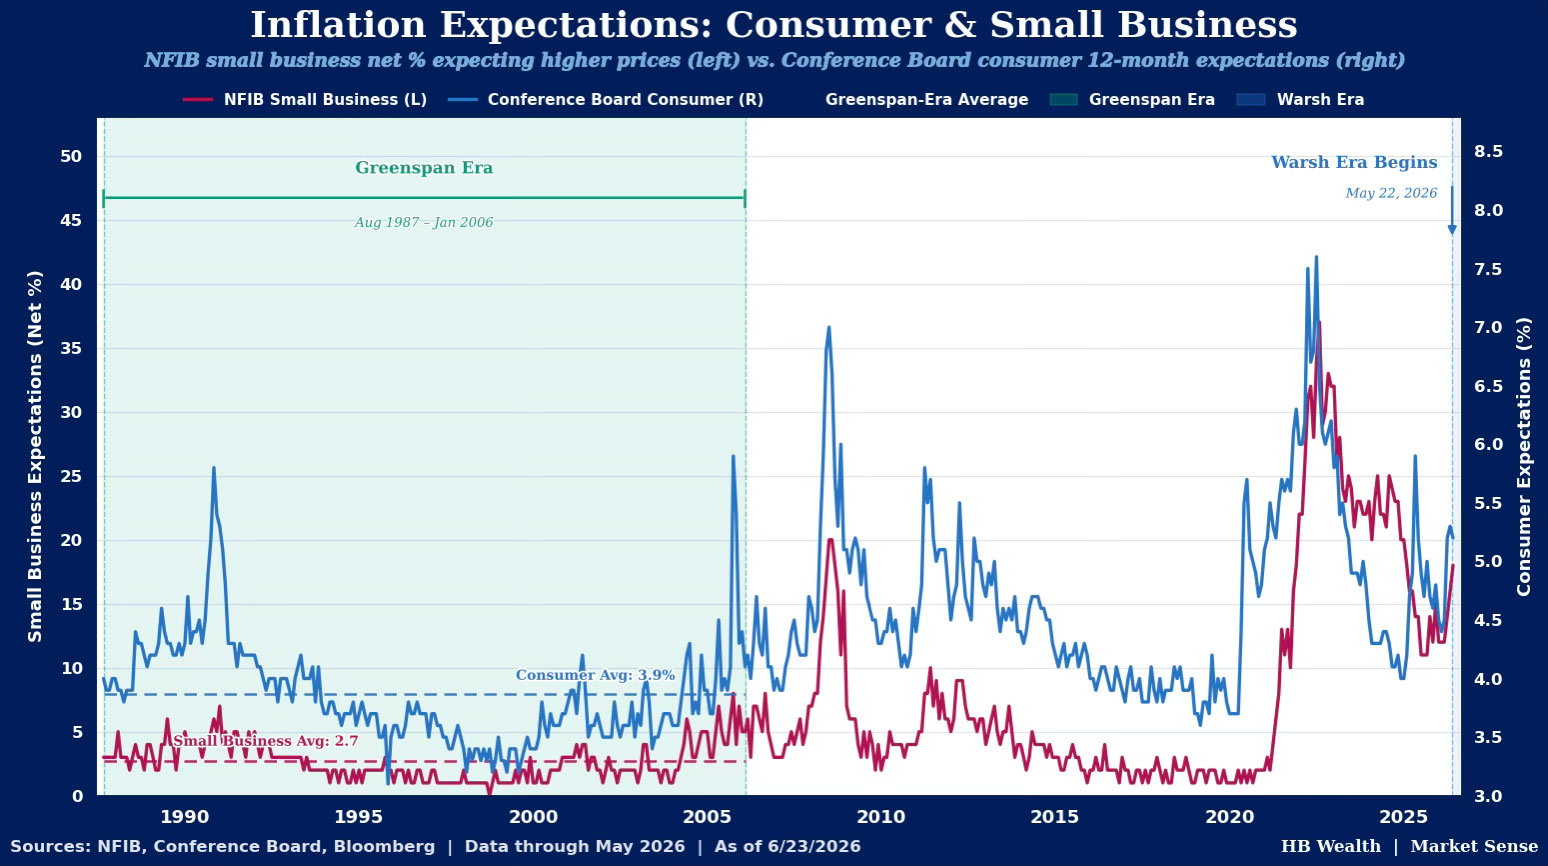
Financial markets’ inflation expectations have stabilized with peace talks in the Middle East, but it may be up to the Fed to help tame the inflation beast in the real economy. After years of above average inflation, consumer inflation expectations and small business inflation concerns both appear somewhat entrenched. Consumer…
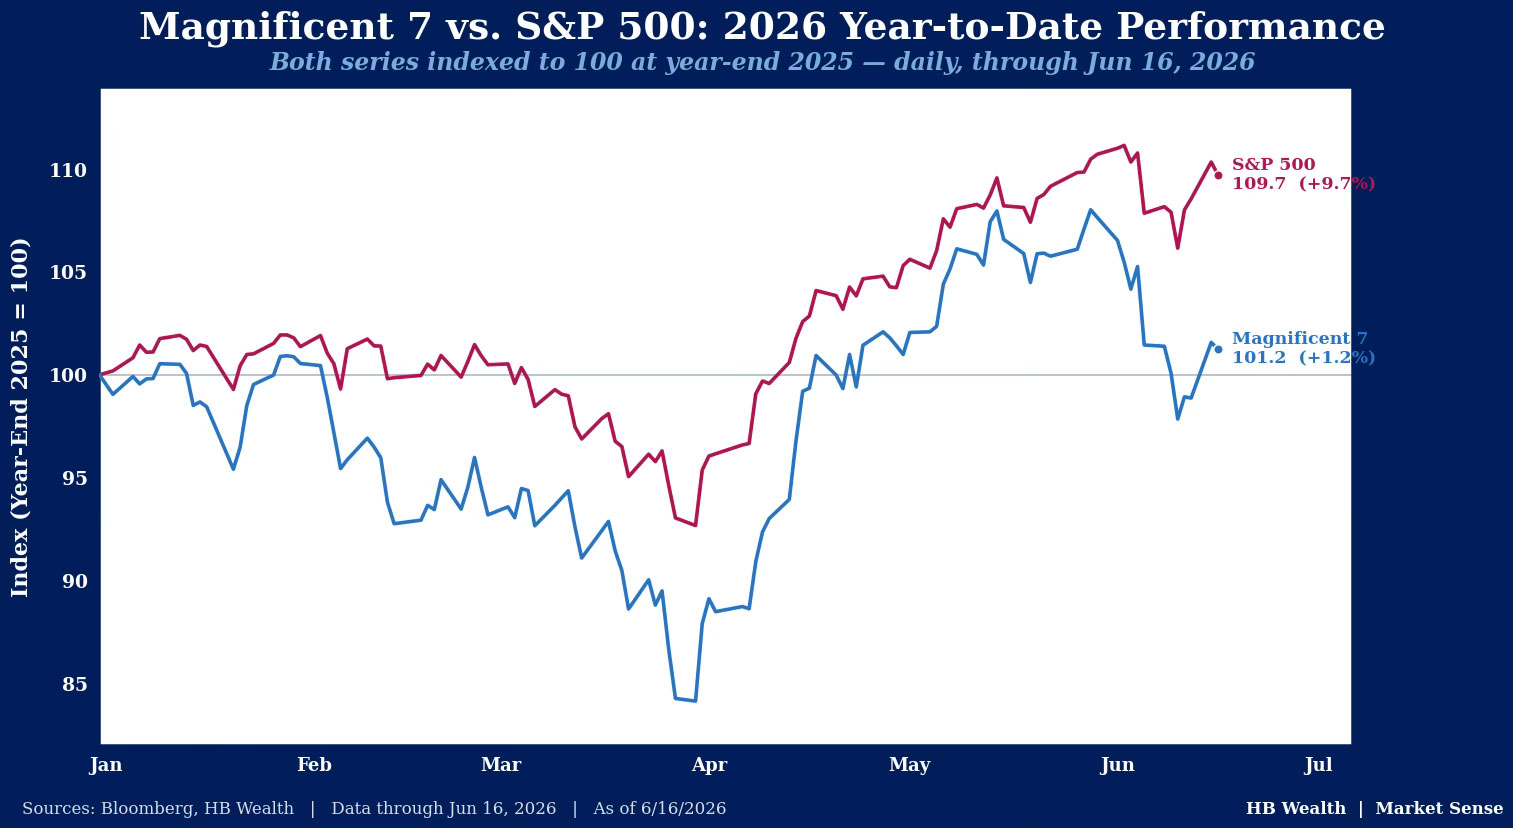
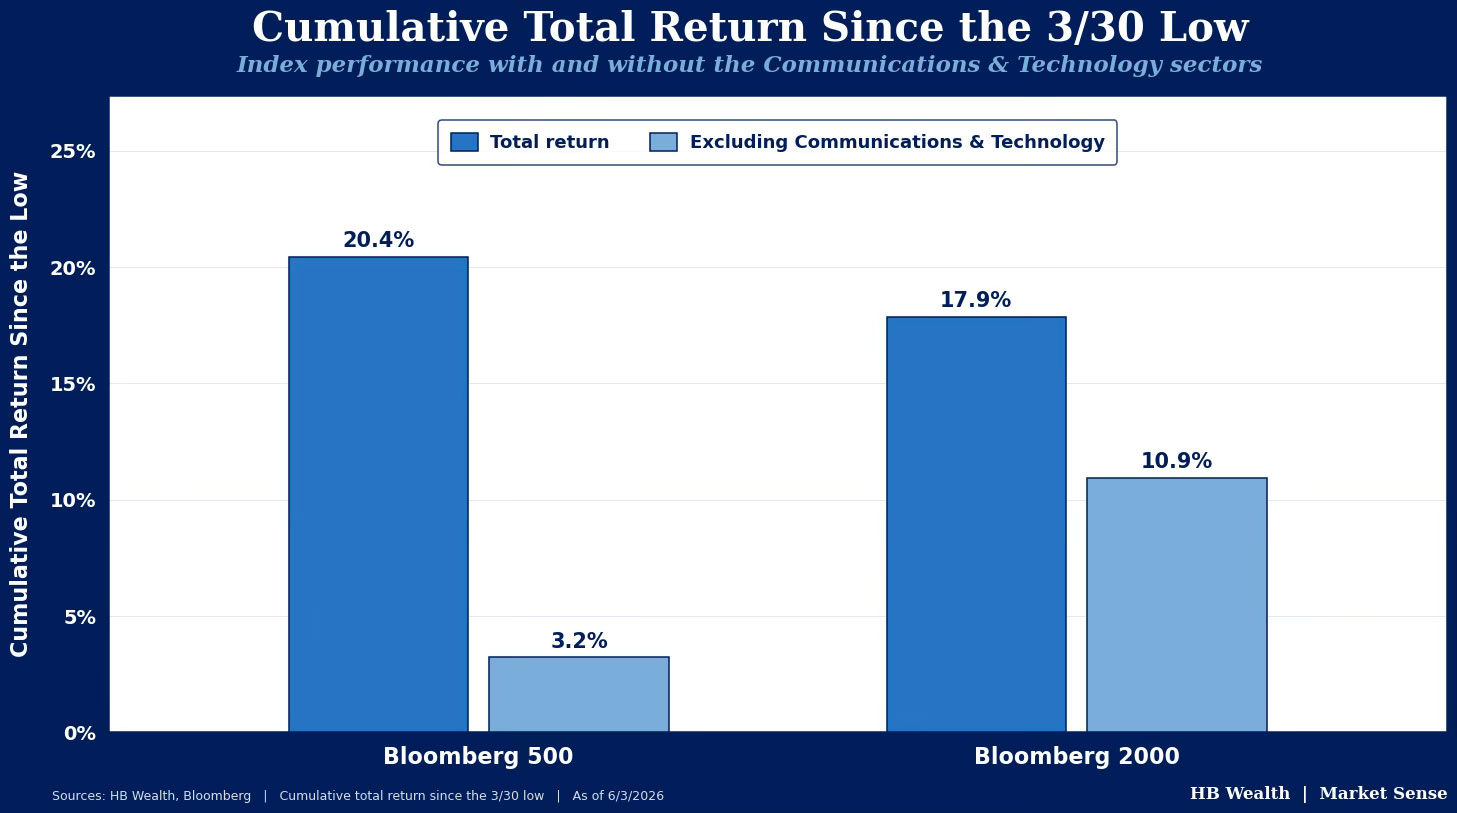
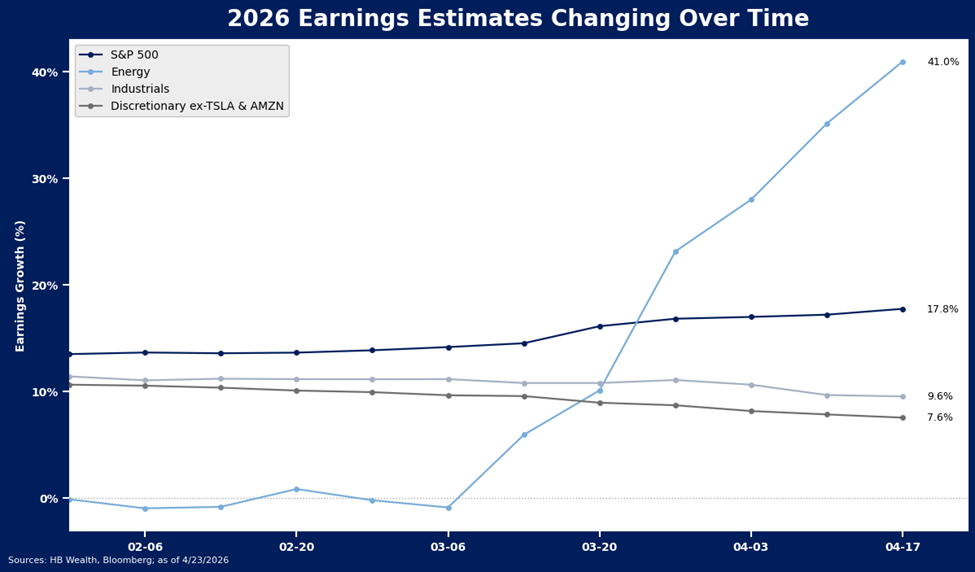
Abstract: The Magnificent-7 has struggled relative to the rest of the market for most of this year, but unlike in 2022, the slowdown in this group is not taking down the market at large. If the consensus of Wall Street analysts is correct, 2Q could be the last quarter of…
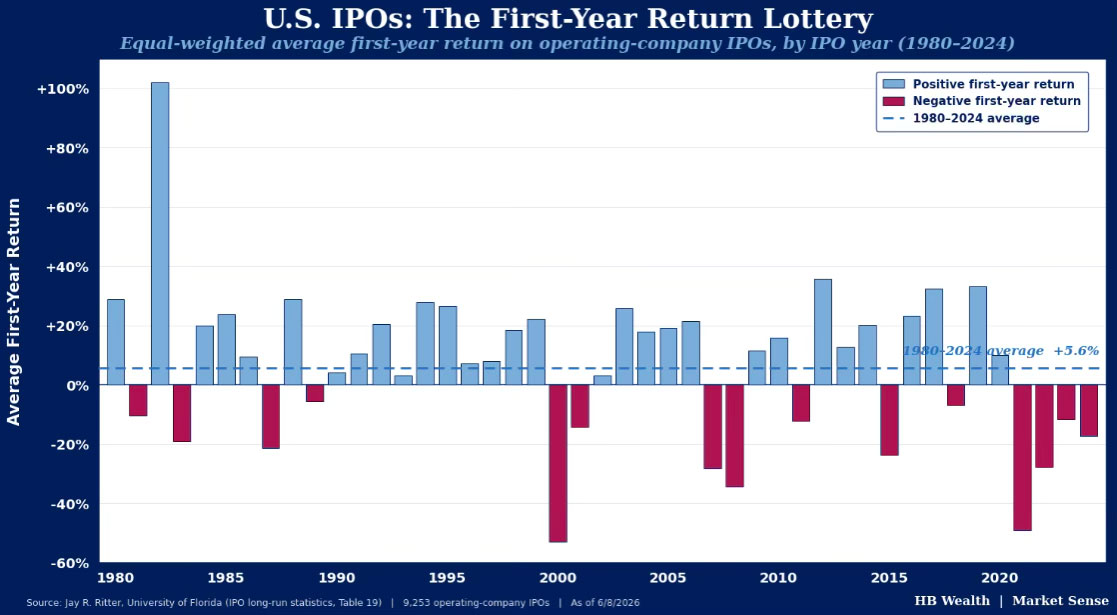
Abstract: SpaceX kicked off what is likely to be a wave of historically large IPOs with its debut on the U.S. market last week. The stock surged 19.2% on its first day of trading, right on the average first-day pop of 19% for IPOs since 1980. New offerings of equities…
The US’ strategic petroleum reserve (SPR) is hitting some of the lowest levels since the 1980s as drawdowns reaccelerated with the conflict in Iran and could approach its lower limits if a proposed peace deal falls through yet again or if traffic in the Strait of Hormuz remains limited. The…
Abstract: U.S. stocks’ multi-year rally looks eerily similar to textbook bubbles that formed ahead of the Great Depression and the dot-com era, but the fundamental contrast to those periods is profound – earnings growth is currently much stronger and companies are significantly less levered than they were at the tail…
Abstract: The undercurrents of the equity market are worth paying attention to, for while parabolic moves in groups like semiconductors threaten to come back to bite large cap stocks, this short run concern may be somewhat offset by a quieter, but significant improvement in undervalued stocks, sustaining the bull trend…
May’s Top Take – Earnings Make the World Go Round If May proved anything it’s that earnings seasons can quickly change the market narrative. Even though the economy rose merely 1.6% in the first quarter on lackluster consumer spending growth, it was a banner quarter for US companies amid rapid…
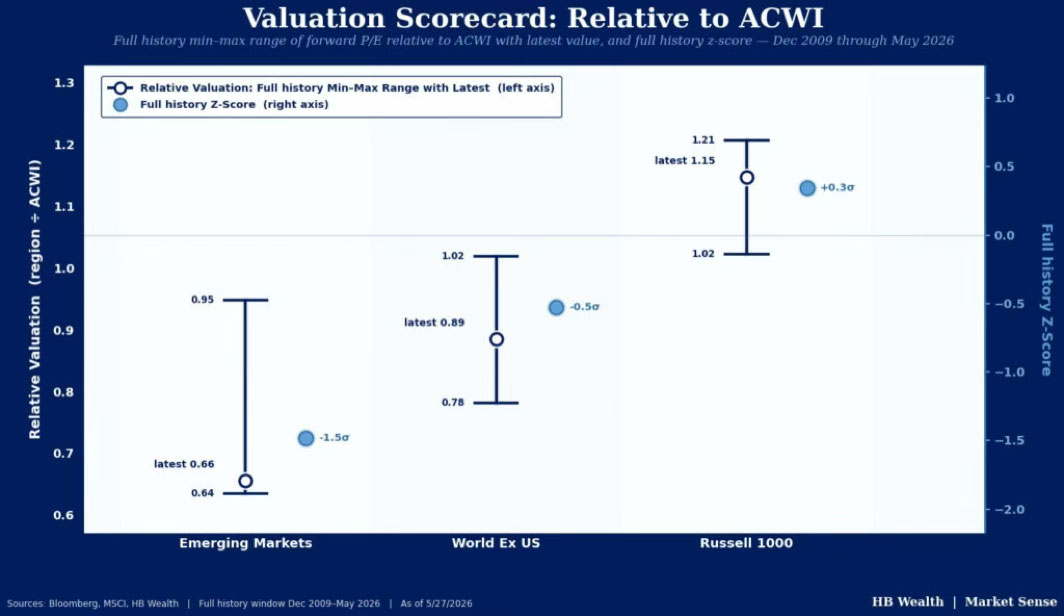
Abstract: Adding nondomestic stocks to an equity portfolio has clear diversification benefits, and both emerging and developed markets stocks are discounted to domestic peers. Strong earnings forecasts for the former hint the gap in multiples could close if consensus is correct, while resolution of turmoil in the Middle East may…
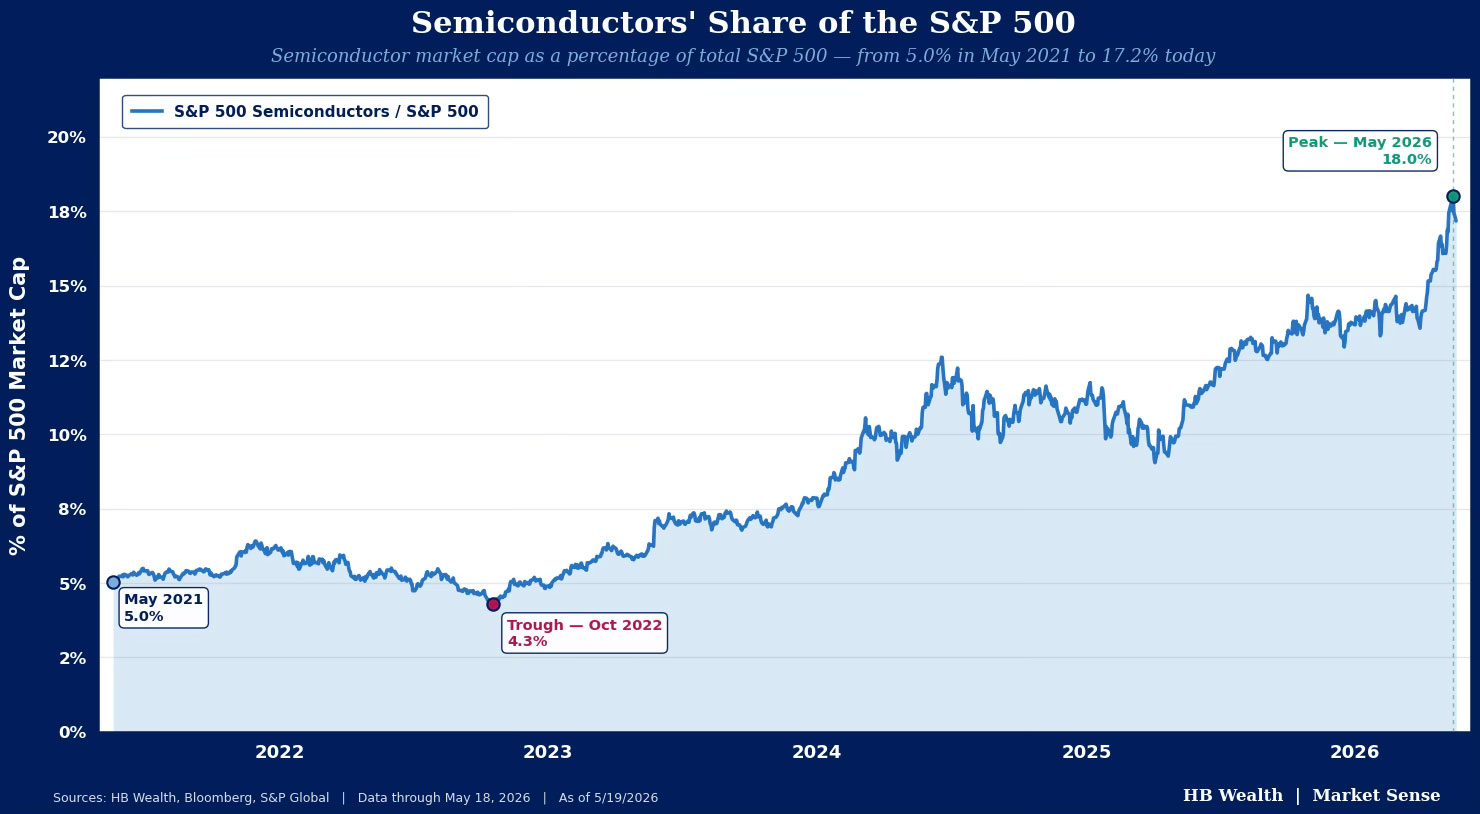
Abstract: One of the largest, risk-tolerance-setting industries in the S&P 500 – semiconductors – has jumped more than 50% from March low to last week’s high as earnings continue to blow past consensus. Technicals may already be in the process of correcting but remain only part of the concern. Valuations…
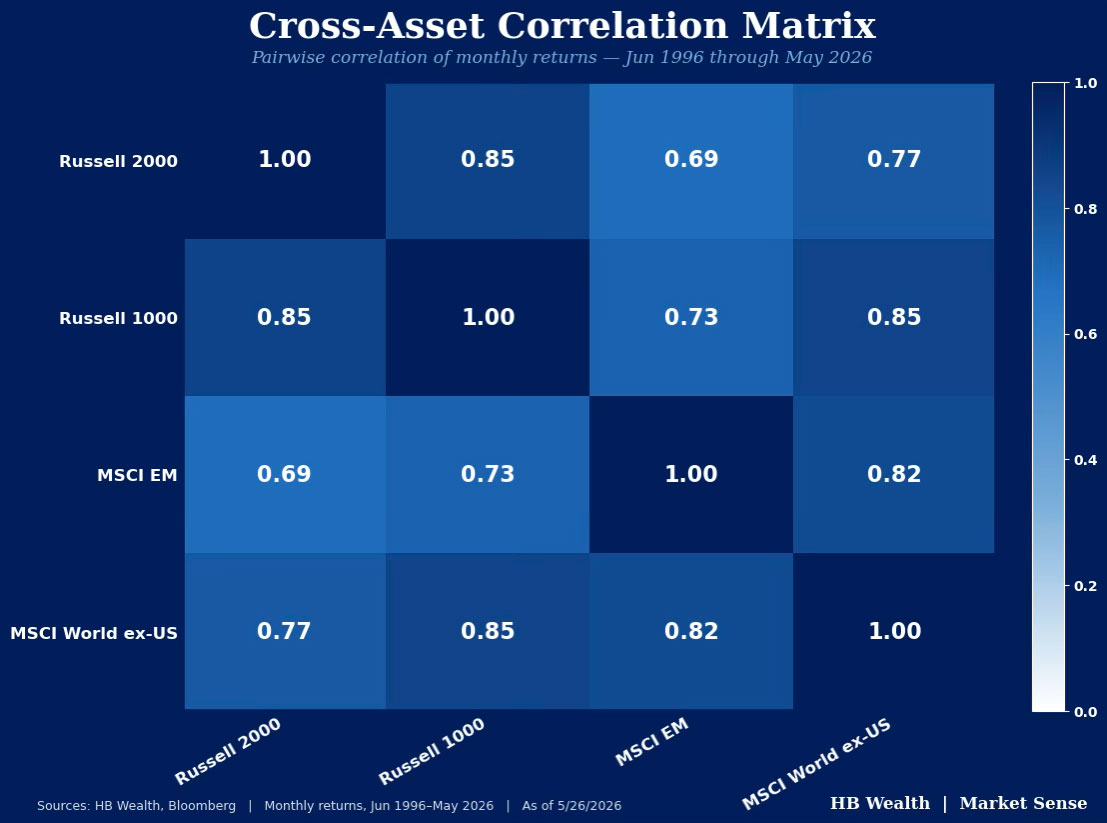
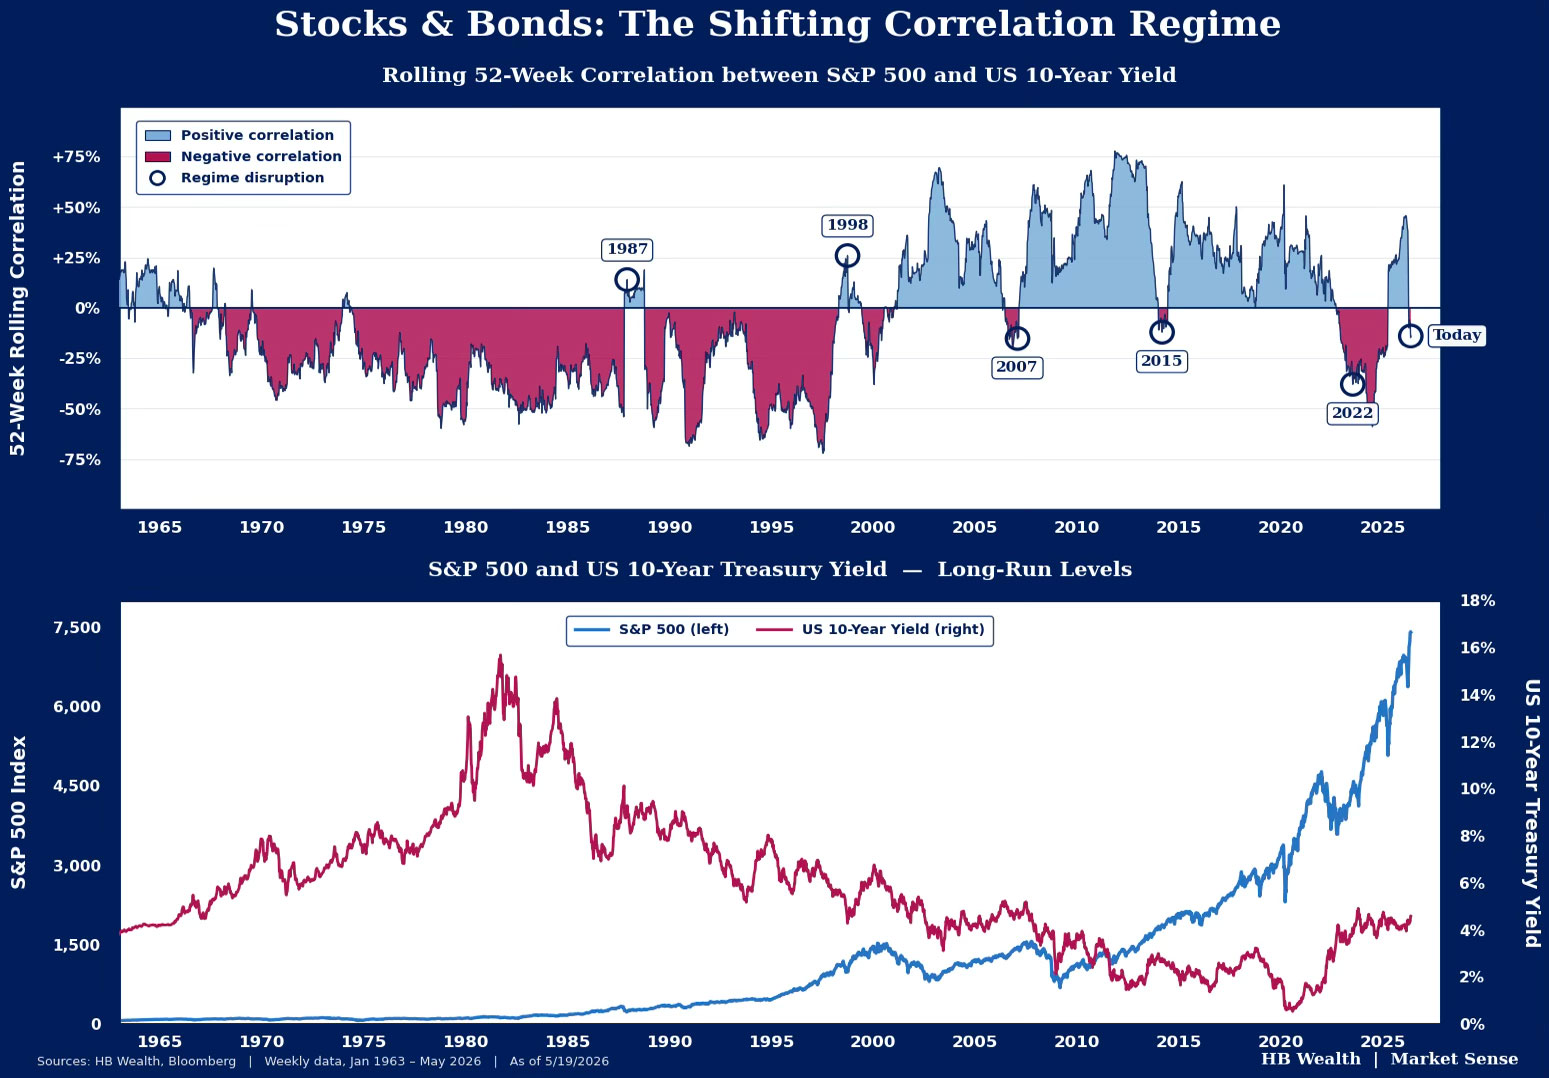
The correlation between U.S. equity prices and bond yields is signaling another risk-off period may be lurking. The asset classes move in regimes – the correlation between stock prices and bond yields was largely positive from 2000-2022 as equities tended to move in the direction of yields as inflation mostly…
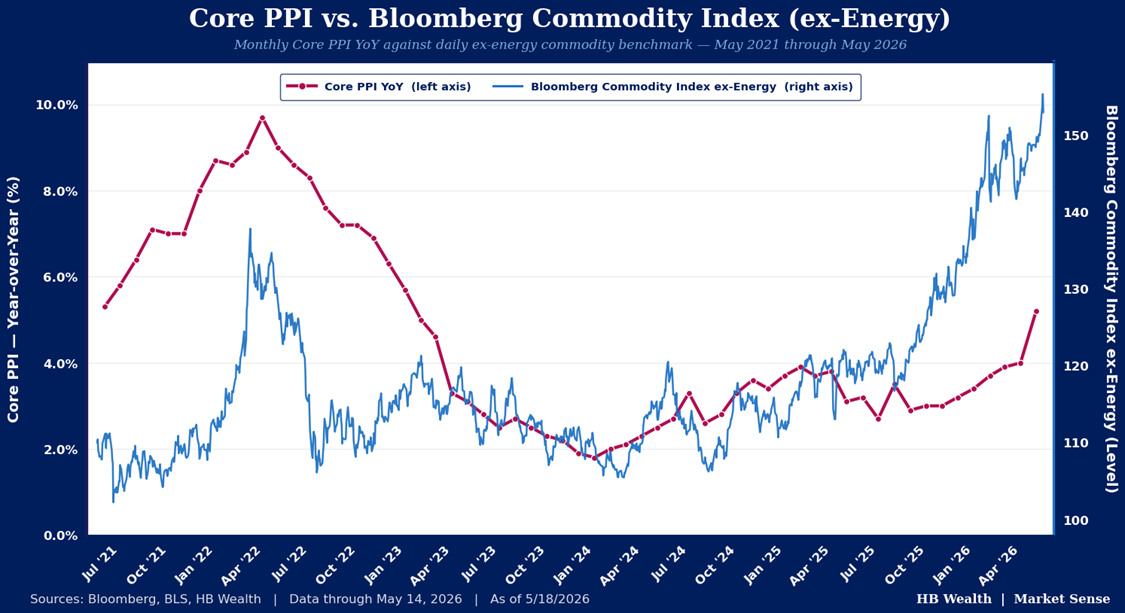
Abstract:Hyperscalers’ plans to spend more than $700 billion in 2026 and another $1 trillion in 2027 building AI infrastructure implies inflation risks may remain, even if supply constraints in the Middle East are resolved. While the financial markets appear to believe inflation is somewhat temporary and due to a supply…
Abstract: AI Disruption Has Growth Leading Quality, but It is Likely Short Term Though tech and fast-growing stocks have blurred the lines between quality and growth factors, the two show different performance over time – most especially during downdrafts. Growth factors usually comprise some form of fundamentals, measuring EPS or…

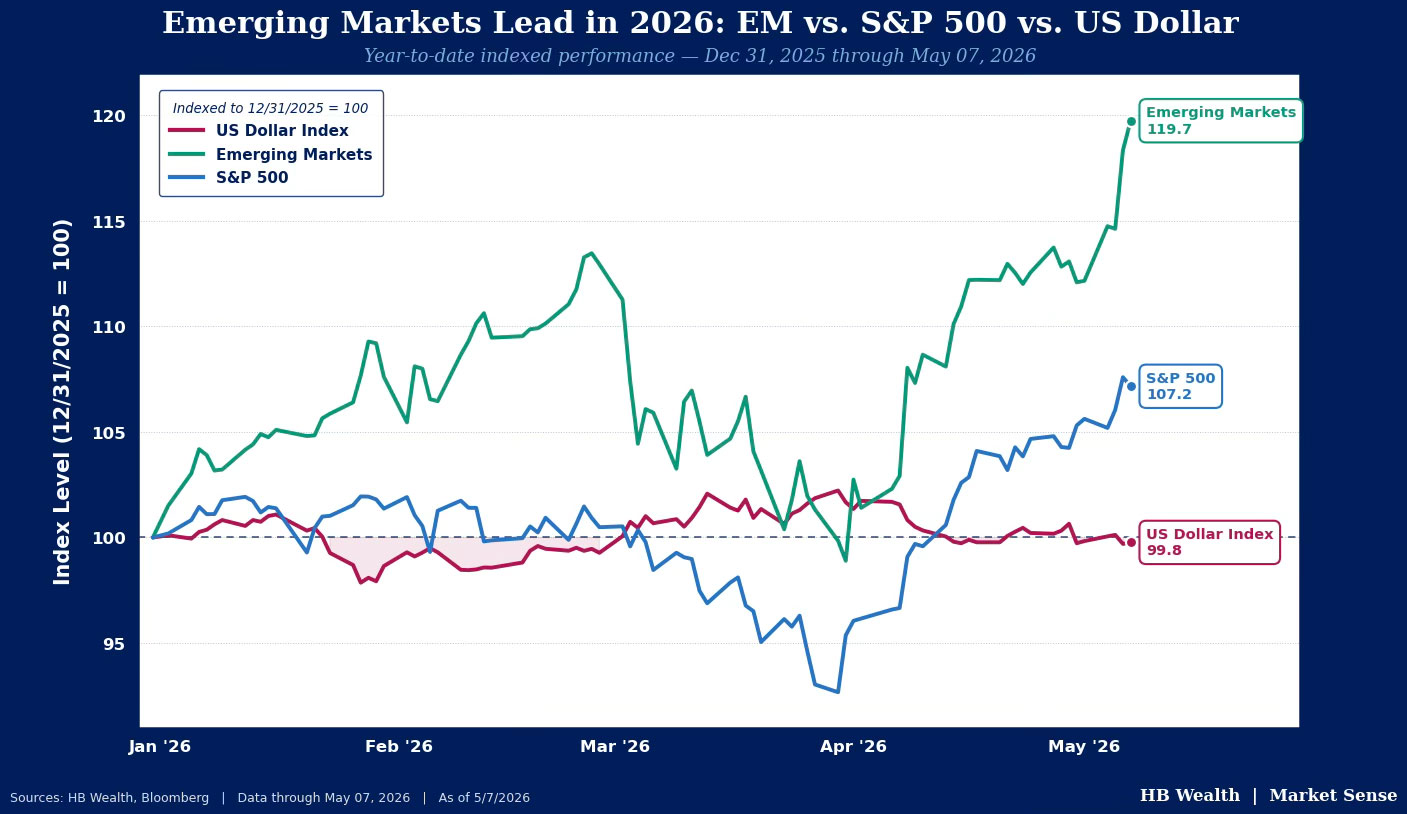
Emerging Market equities are on pace for a second consecutive year of outperforming U.S. stocks, the first back-to-back annual outperformance since 2010. So far this year, the group has outperformed U.S. large caps by more than 2X, up nearly 20% versus the S&P 500’s gain of 7%. Notably, emerging…
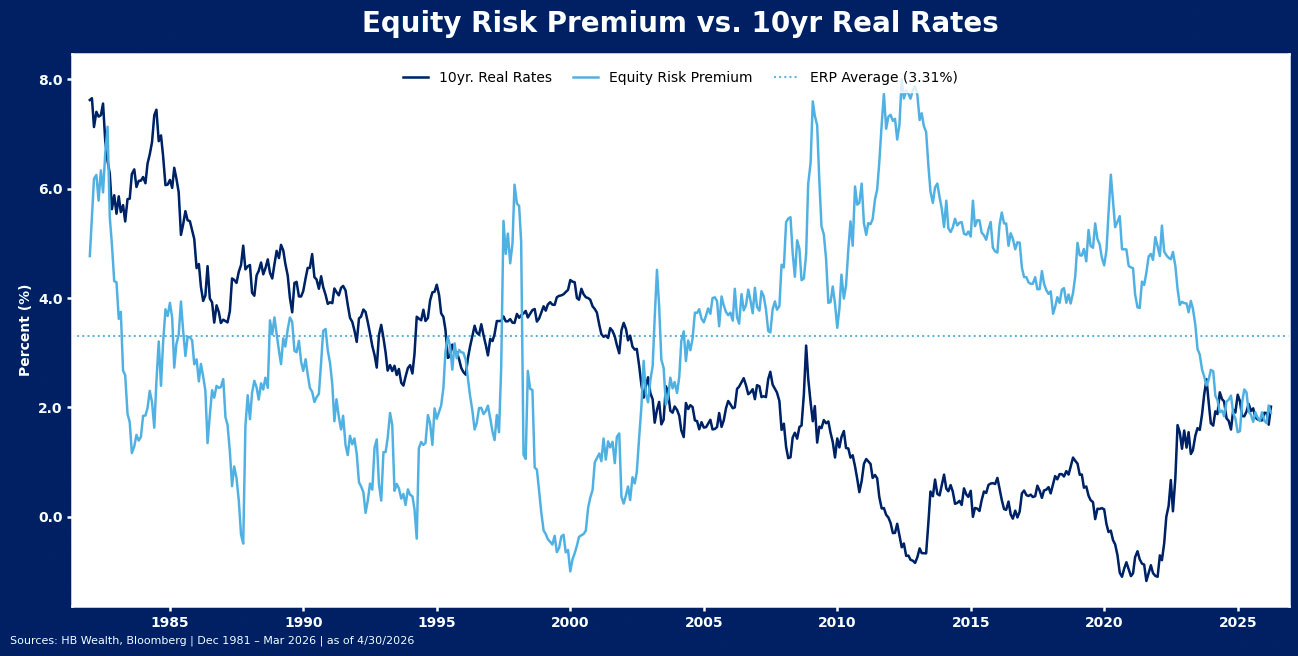
Abstract: Equity Risk Premium’s Normalization More About Real Rates Than Expensive Stocks The equity risk premium (ERP) – commonly defined as the difference between the earnings yield on stocks and 10-year real interest rate – suggests that stocks are the most expensive they’ve been since well before the Great Financial…
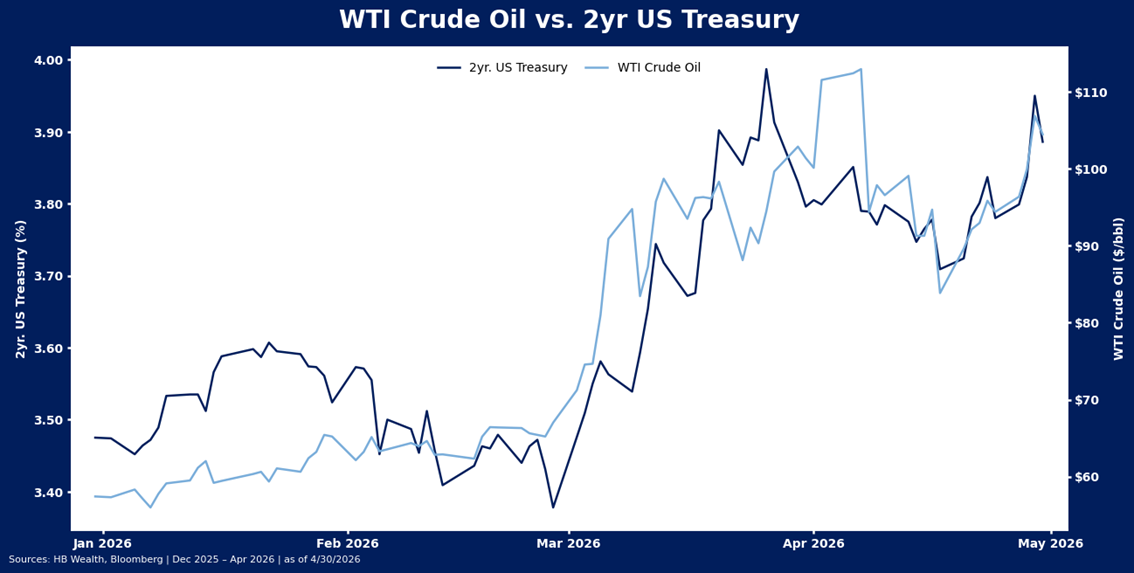
A notable divergence emerged between equities and bonds in April, with 2-year Treasury yields tracking oil prices closely, and equities largely shrugging off the risks that have emerged with ongoing turmoil in the Middle East. The 2-year Treasury yield is back to 3.89%, its highest level since late March, moving…
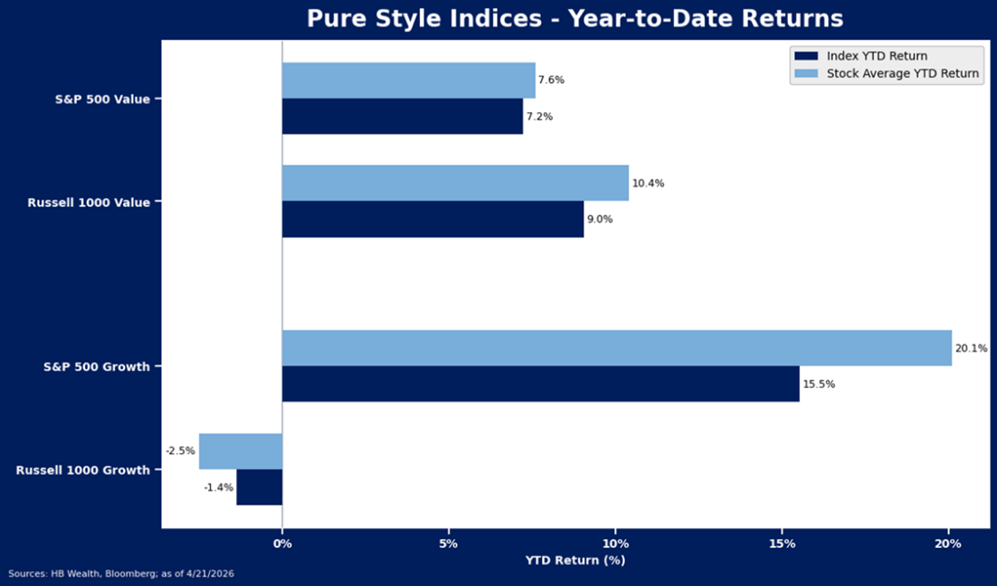
Abstract: Value Has Supports that Growth Lacks The largest of large cap growth stocks have roared back from late-March lows as investors have gravitated back to perennial favorites on the presumption that recovery from war-time strain may prove similar to recovery from tariff-policy stress. However, there is an underlying weakness…
Earnings season is helping to boost the mood for equity markets. Despite souring economic data at the tail end of Q1, the S&P 500 is on track to record about 12.4% YoY EPS growth for the quarter. This is in line with the pre-season expectation, and a modest slowdown from…
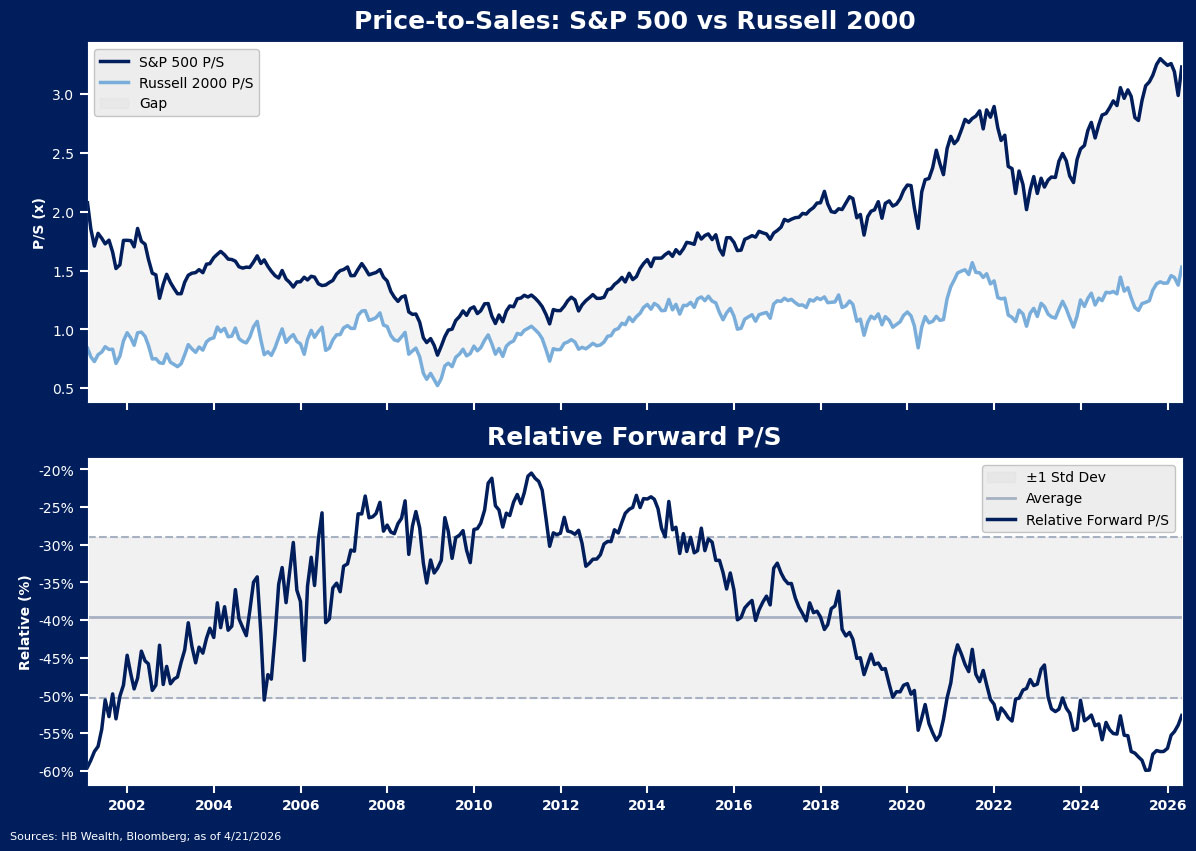
Abstract: Russell 2000 Is Getting Sparks from Revenues, Macro and M&A Small cap stocks have long been discounted to the S&P 500 as mega-cap dominance now extends back nearly a decade. However, in 2026, the Russell 2000 is finally getting the sparks it needs for a period of outperformance –…
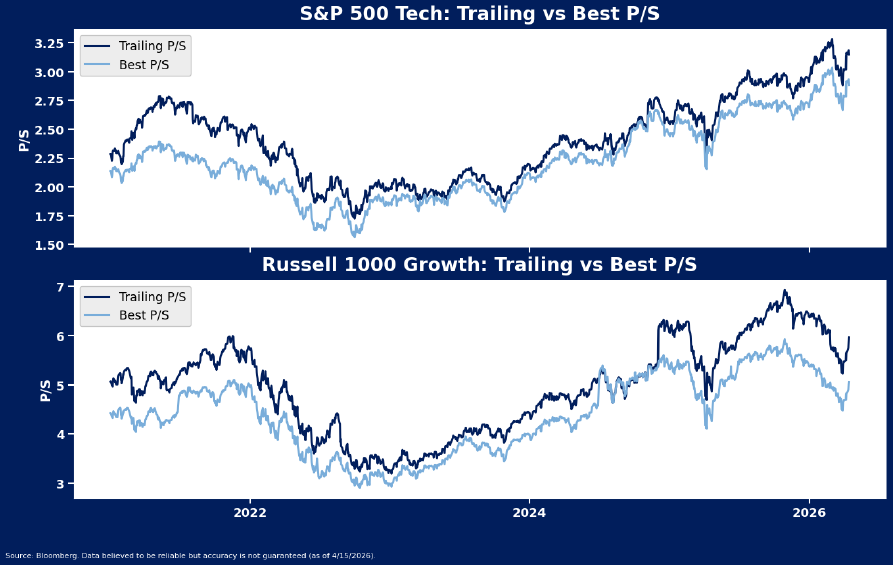
Abstract: Discounted forward valuations are giving some investors the impression that the tech sector is much cheaper than reality. While it’s the one undoubtedly cheap segment in tech, software terminal value risks from AI make risk taking difficult in aggregate even if company opportunities exist. Meanwhile, the highest multiple stocks…