U.S. equity market valuations are starting to reflect inevitable inflation and growth risks of war in the Middle East, and while this may be enough to catalyze opportunistic dip-buying on a selective basis, optimistic analyst sentiment may continue to impede the formation of a more durable advance. Contrary to the view that strong growth forecasts are reason for cheer, history shows that analyst sentiment after peaks in stocks requires a contrarian take. Thus, downward estimate revision from the analyst community may be a final shoe that needs to drop for stocks to make a sustainable low.
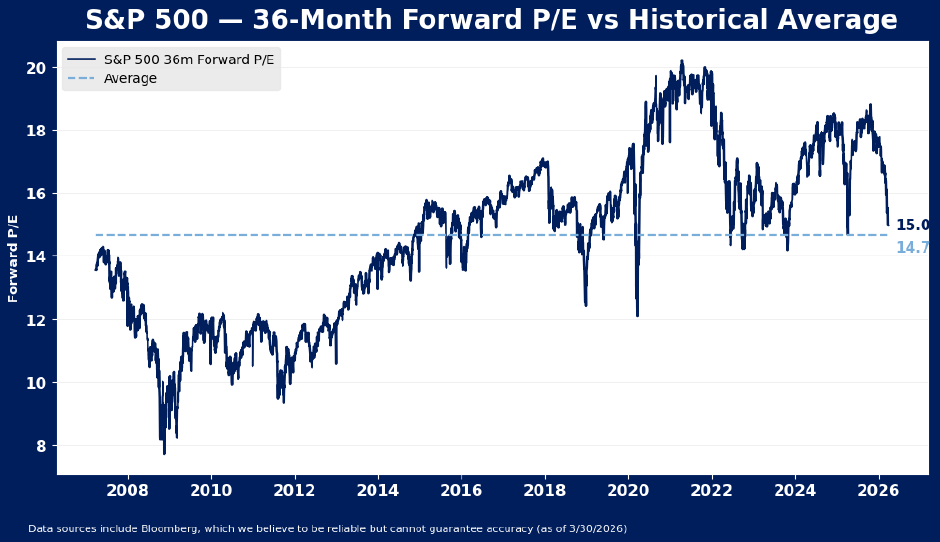
Normalized Multiples Are Approaching Former Lows
Valuations are imperfect timing mechanisms, but on a normalized basis are now close to the level that marked the low for stocks last year. On a blended forward 36-month basis, S&P 500 multiples are now approaching 15X earnings. Lows in 2022 and 2023 occurred closer to 14X, and the low in 2025 occurred at 14.7X. It is likely that fundamental damage from the closing of the Strait of Hormuz and destruction of mining facilities throughout the middle east is going to be more significant than the shock from tariff policy, but the 15x level may nonetheless spark some near term dip buying, as the correction has gone a long way toward removing excesses that emerged in equity markets by late 2025.
Analyst Forecast Still Needs to Drop
Though markets have started to price an earnings disruption, analyst forward earnings forecasts have not started to capitulate to the inevitable economic damage of war, and that may also be necessary before stocks can find a low. Analyst estimates have been going higher throughout the downdraft in stocks this year. This is not unusual, nor should it provide solace with respect to the outlook. Instead, interpretation of this analyst estimate “resilience” should be contrarian. Analysts are often slower than markets. In fact, analyst estimates moved higher at the start of selloffs in 2018, 2022 and 2025 as well. The only recent major correction when analysts did not lag the market materially was in 2020, when economic shutdown made it clear that earnings were not going to continue to rise.
In recent history, analyst capitulation to downdrafts in the market has offered a pretty good indication of lows forming in stocks. In 2022, analyst forward 12-month EPS forecasts touched a high in June 2022 and fell 1.7% before the market made its low 16 weeks later. Even in the relatively swift correction of 2025 that lacked an accompanying earnings downdraft, analyst negative estimate revisions were a precondition for a low in stocks. On average, analyst forecasts peaked over 42 days after stocks peaked in the 2018, 2020, 2022 and 2025 corrections. The forecast peak on average was a touch closer to the low than the high in stocks as the average was just 39 days before stocks bottomed. Analyst estimates also tend to fall for quite some time after market lows have been reached. On average, estimates hit lows 49 days after markets hit bottom.
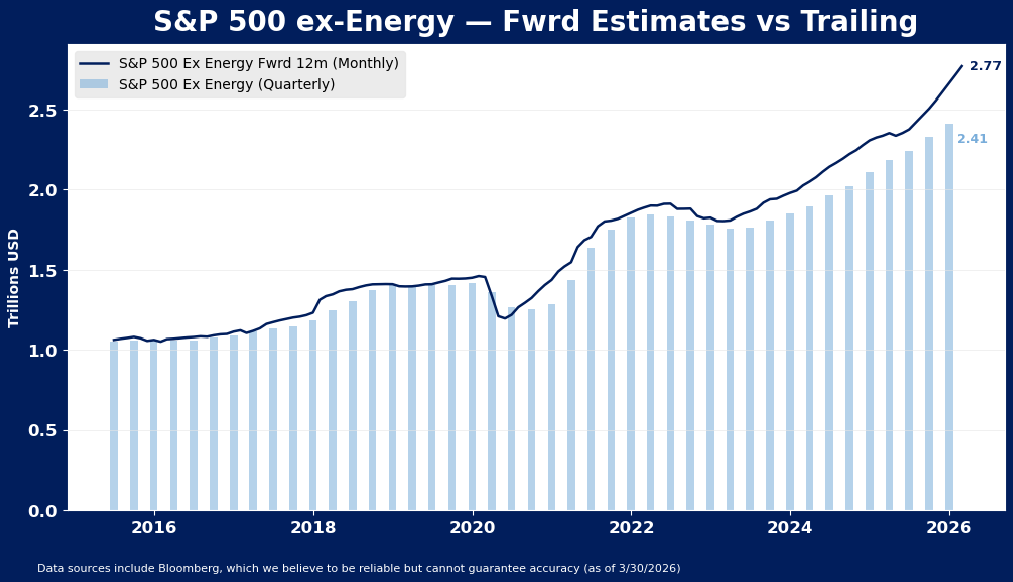
As we mentioned in our March 17th note, “The Inflation Clock is Ticking on Earnings”, analyst expectations for ex-energy profits are likely to be particularly telling this cycle. Much like in 2022, energy sector estimates are likely to move higher to reflect the improvement in base commodity prices, distorting index headline earnings. But profits damage from extreme moves in commodity prices is inescapable, and ex-energy earnings forecasts will need to adjust lower to reflect a more troubled outlook for both revenues and margins among non-energy companies in the index. Analyst acceptance of this fact has historically been a precondition for a low forming in the broader equity markets, and is likely to be necessary this time as well.