Abstract:
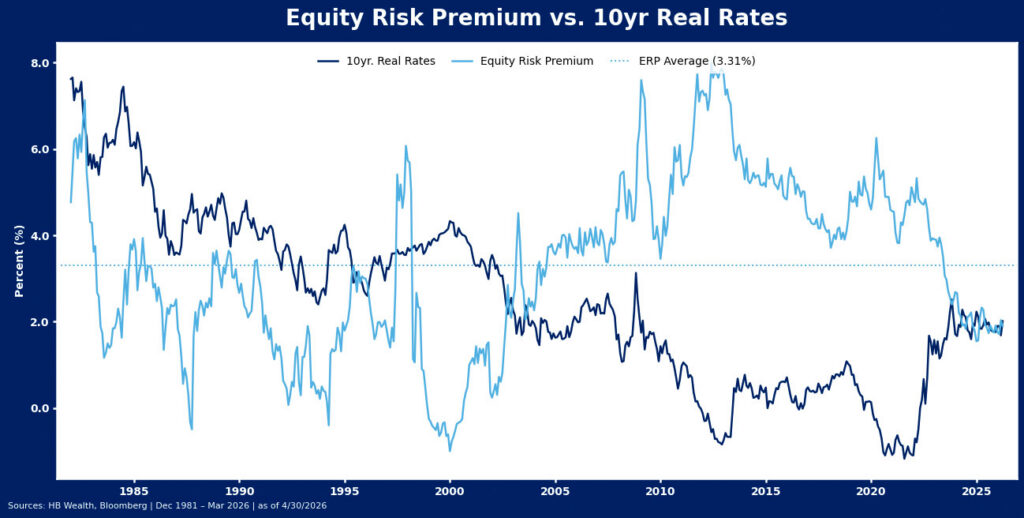
- The equity risk premium (ERP) is hovering around 190 bps, a level last recorded around the tech bubble, suggesting that stocks are expensive relative to inflation linked treasury bonds.
- However, most of the recent change in the ERP has occurred due to bonds selling-off amid higher rates and inflation. Stock’s earnings yield is low but has been roughly unchanged in the last five years.
- The current ERP isn’t necessarily worrisome for forward equity returns. It’s roughly on par with the pre-2000 norm which accompanied an annualized 14.8% rise in the S&P 500. The long-term average rolling annual gain is 8.1%.
- Greater risk to stocks emerges if the ERP slips to the fourth quartile of historical observations – where stocks historically struggled with below-average forward returns. Prospects for this may depend mostly on how bonds handle a Warsh-led Fed.
- A negative ERP – which occurred only ahead of Black Monday in 1987, during the global bond crisis in 1994 and right before the end of the dot-com bubble – is the real tripwire for stocks.
Equity Risk Premium’s Normalization More About Real Rates Than Expensive Stocks
The equity risk premium (ERP) – commonly defined as the difference between the earnings yield on stocks and 10-year real interest rate – suggests that stocks are the most expensive they’ve been since well before the Great Financial Crisis. While equities’ surge has undoubtedly played a part, the ERP’s recent drop appears to be more a function of rising real rates – placing the onus on Fed policy to help unwind equities’ premia. Though the ERP is the lowest it’s been in over two decades, that might not matter much to forward returns with current levels roughly on par with the gauge’s 1980-2000 regime. Despite a negative risk premium for much of that period, stocks managed to post strong annualized gains.
It’s the Rates! Equities’ Relative Premium is Mostly About Bonds
The equity risk premium (ERP) – the difference between stocks’ earnings yield and the real 10-year rate – has fallen sharply since 2022, suggesting that equities have gotten a bit more expensive, at least relative to bonds. However, that post-2022 shift appears primarily because bonds have gotten much cheaper from what was historically expensive levels. The drop in premium is less due to the ongoing rally in equities, which has been sustained by a surge in earnings.
What Does a Tighter ERP Mean for Equity Returns? Historical Evidence Is Mixed
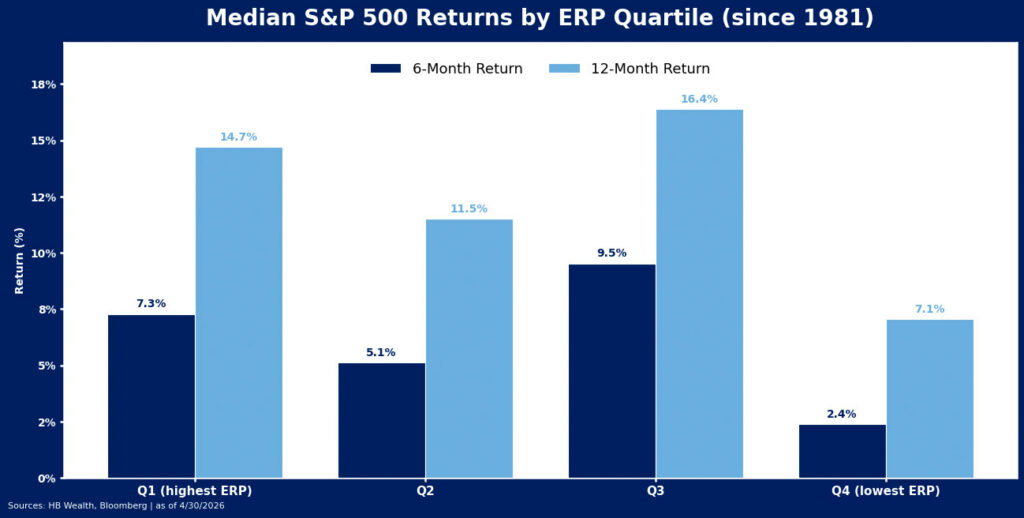
The post-Great Financial Crisis cycle through the covid-19 recession and early recovery period was an unusually favorable backdrop for stocks. The combination of Zero Interest Rate Policy (ZIRP) and quantitative easing (QE) for much of that time deeply suppressed real rates, making equities relatively attractive. From the end of 2009 through 2021, the S&P 500 gained an annualized 12.9% while real rates averaged just 18 bps. For most of that period, the ERP was in the top quartile (highest) of monthly observations back to 1981 which likewise produced a median one year forward 14.7% return (other observations in that quartile include 1997-98 and 1982).
The current ERP is in the 3rd quartile. This is historically associated with a 16.4% year ahead median return thanks to a heavy concentration of observations in the 1980s, mid-1990s before the froth of the internet bubble took hold, and current post-2022 cycle. If stocks slip into the bottom ERP quartile, that could spell slower returns ahead. The ERP has already been flittering in and out of that fourth quartile for much of the past year. From current levels, all it would take is a 2-bps slip in the earnings yield to get there. Year-ahead returns when the ERP was in the fourth quartile were a median 7.1%.
The real pressure point for stocks appears to be following periods where the ERP flips to negative. Such a condition is theoretically perverse, essentially signaling that investors are not being compensated for taking risk in equities. This has occurred just three times since 1981 – in summer 1987, briefly in March 1994, and December 1999. The 1987 event immediately preceded Black Monday – one of the most violent stock market crashes on record. The S&P 500 fell 31.8% over a two-month span with the bulk of the selloff occurring over just four trading days. A global bond-market crisis in 1994 precipitated the ERP flip to negative, but that experience coincided with a relatively minor peak-to-trough stock market pullback of 8.9%. Of course, December 1999’s negative ERP came just three months before the S&P 500 made its final high of the dot-com bubble and was followed by a 49.2% selloff and global recession in 2001.
ERP Risk – Watch the Warsh Fed’s Balance Sheet Moves
With equity multiples already pricey and reaching something of a ceiling, a move to a negative ERP would likely require a global bond selloff, and the most logical path to such a scenario runs through the Fed. The 10-year inflation linked treasury appears to have a strong relationship with central bank policy – the two periods of negative real rates came amid a combination of rate cuts and quantitative easing and likewise, climbs since 2009 have occurred during rate hike and tightening cycles. Most recently, the run up in 10-year TIPS from 2017-2018 coincided with the onset of quantitative tightening amid a rate hike cycle, and the surge from 2021 lows began as rates rose and kicked into overdrive with the shrinking balance sheet. This could be a key dynamic to watch under a Warsh-led Fed. The future chair strongly believes that rates should be the primary tool for central bank policy and wants to make efforts to shrink the balance sheet. If the Fed follows his lead, the probability of a negative ERP could emerge.