


Stocks’ technicals continue to weaken, and for the first time in the post-Liberation Day bull market, U.S. large cap stocks are testing their 200-day moving average. In the words of Paul Tudor Jones, “Nothing good happens below the 200-day moving average.” While indeed, a close beneath this level increases the probability of more elevated volatility to come for stocks, it also suggests some of the froth in large cap equities may be finally starting to be removed. There is more room for derating to continue for stocks to reach levels consistent with what our model suggests is fair value.
The 200-day moving average has historically offered strong guidance with respect to the overall condition of the equity market. Drops below the moving average have historically triggered more volatile trading. Since 1990, the VIX averaged 16.9 when the market was above the moving average, but surged to average 27.2 when the index was below the moving average. Extreme returns, both positive and negative, cluster during the high volatility periods beneath the 200-day moving average, as economic uncertainty dominates market price action. Since 1990, 45 of the 50 largest daily gains and 48 of the 50 worst losses occurred when the S&P 500 was trading below its 200-day moving average.
While this history suggests we should prepare for more volatility if the equity market decisively breaks down beneath the key moving average, there is one “good” thing that also usually happens below the key level – buying opportunities emerge. As equity markets get more volatile, they also remove more froth, revealing discounts for the investor focused on the longer term.
In that vein, a dip below the 200-day moving average may be the first indicator that the market is finally starting to capitulate from an overly optimistic position. For an indication of full capitulation two things are likely to happen. First, volatility, represented by the VIX index, may need to spike to a level that indicates panic has set in. Historically, once the market drops below the 200-day moving average, the VIX index spikes to at least 30, and often over 40, to suggest a full panic has emerged in equities.
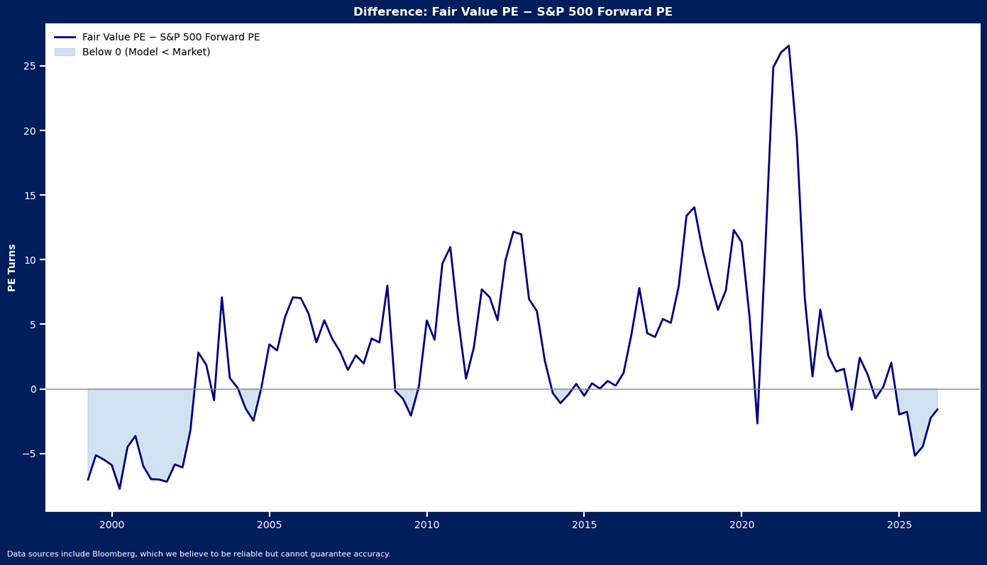
Second, valuations likely need to adjust to reflect much lower expectations. On average, stocks overcorrect multiples to account for risks. The average low in forward P/E after VIX hit 30 since 2007 was 15.3x and the average forward P/E after VIX hit 40 was 13.2x. At the very least, valuations may need to adjust to levels closer to fair value, as implied by our macro model. Valuations prior to the start of war were extremely high, at 21.3 times forward earnings, well north of the 19X our model suggests is justified by economic conditions. The decline in prices has already started to erode some of that premium, though with the market trading at around 20.2 times forward earnings now, there remains more room to the downside for valuations to reach our fair value estimate.
In sum, a market dip beneath the 200-day moving average suggests a higher probability that a period of more elevated volatility is likely emerging. It remains to be seen how long it will last once it sets in. Key indicators such as the VIX level and valuations can offer guidance as to when it may be approaching its final stages.
Disclosure: HB Wealth is an SEC-registered investment adviser. The information reflects the author’s views, opinions, and analyses as the publication date. The information is provided for informational purposes only and does not constitute an offer to sell or a solicitation of an offer to buy any investment product. This information contains forward-looking statements, predictions, and forecasts (“forward-looking statements”) concerning the belief and opinions in respect to the future. Forward-looking statements involve risks and uncertainties, and undue reliance should not be placed on them. There can be no assurance that forward-looking statements will prove to be accurate, and actual results and future events could differ materially from those anticipated in such statements. The information does not represent legal, tax, accounting, or investment advice; recipients should consult their respective advisors regarding such matters. Certain information herein is based on third-party sources believed to be reliable, but which have not been independently verified. Past performance is not a guarantee or indicator of future results; inherent in any investment is the risk of loss.

