


Market Sense: Economic and Market Research
By:


Abstract: S&P 500 earnings face high hurdles this earnings season but given the ongoing conflict in Iran and the drastic effects that AI-spending could have on free cash flow, success in 1Q will be much more about guidance and the forward outlook than clearing consensus expectations. Operating margins and their…
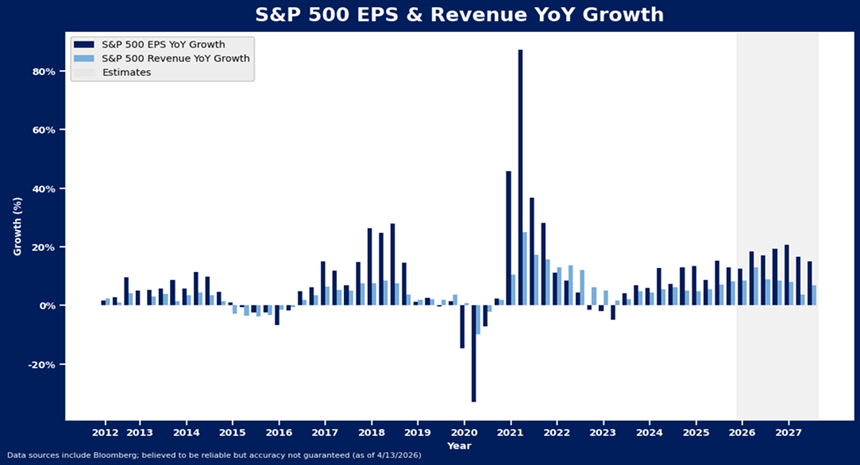
While strains from the conflict in Iran are already apparent in economists’ GDP forecasts, S&P 500 earnings estimates have hardly budged. The rub: GDP is heavily tilted towards consumption, increasingly at risk thanks to elevated oil prices, while earnings instead follow business investment. Thus, bottom-lines are likely to be revised…
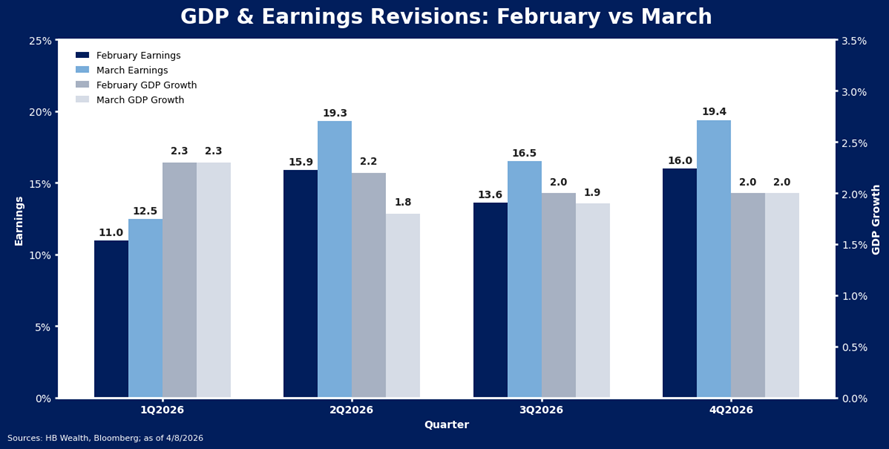
Ceasefire in the Middle East is undoubtedly encouraging news, and if it leads to peace and stability in commodity prices and a stable reopening of the Strait of Hormuz, it could also help support the fundamental case for equities. However, even if peace is achieved in short order, earnings forecasts…
U.S. equity market valuations are starting to reflect inevitable inflation and growth risks of war in the Middle East, and while this may be enough to catalyze opportunistic dip-buying on a selective basis, optimistic analyst sentiment may continue to impede the formation of a more durable advance. Contrary to the…
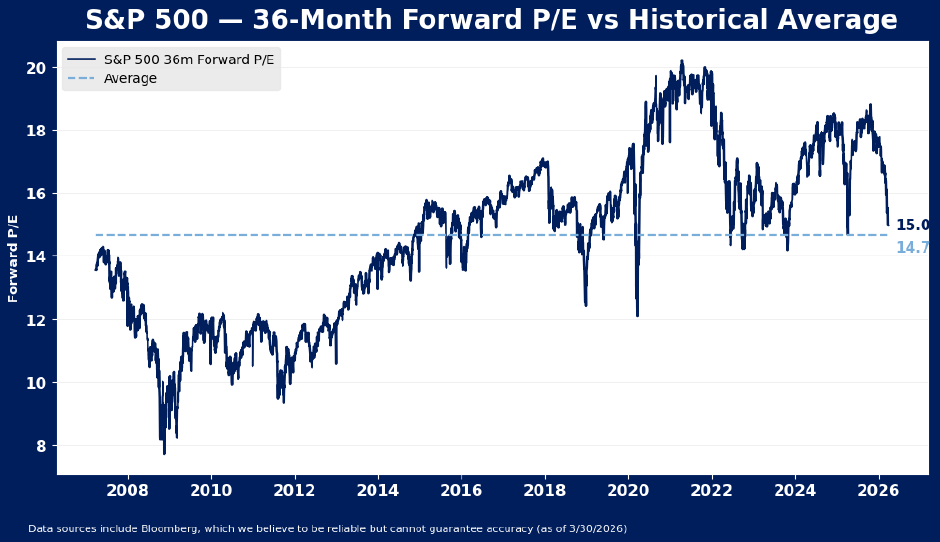
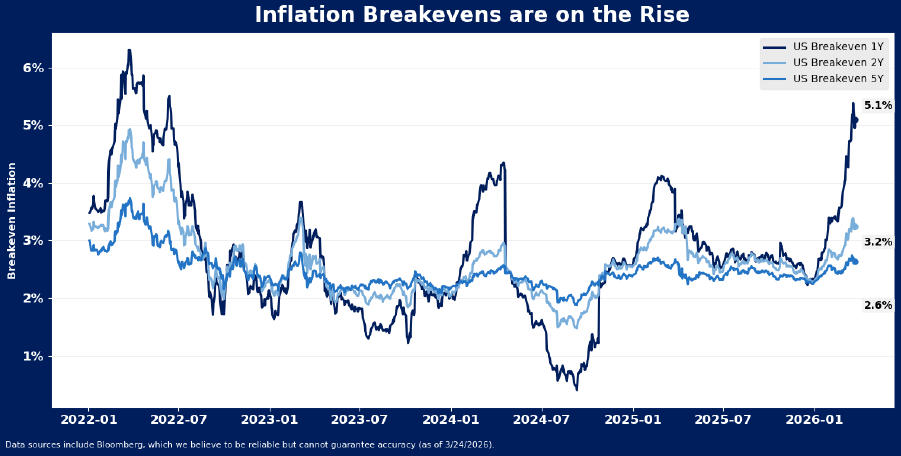
Even if the recent spike in commodity costs proves fleeting, a secular reality of higher average inflation with large spikes may be setting in, and this may be tricky for stocks to shrug off, particularly at current valuation levels. The bond market’s implied inflation expectations for the next year have surged beyond 5%, the highest level…
Stocks’ technicals continue to weaken, and for the first time in the post-Liberation Day bull market, U.S. large cap stocks are testing their 200-day moving average. In the words of Paul Tudor Jones, “Nothing good happens below the 200-day moving average.” While indeed, a close beneath this level increases the…
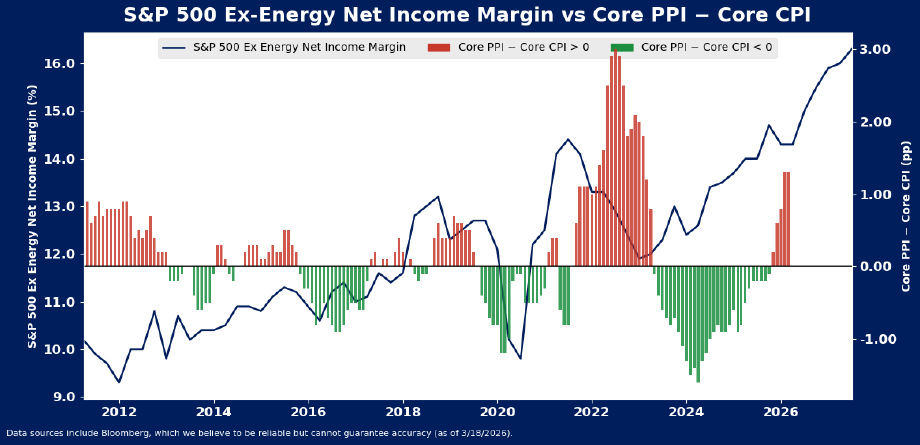
Producer prices rose at a faster than expected pace in February, continuing a streak of worrisome inflation signals for stocks. Core producer prices rose 3.9% over the last year, outpacing core consumer prices for the 5th consecutive month. Headline producer prices rose 3.4%, likewise outpacing overall consumer price growth by…
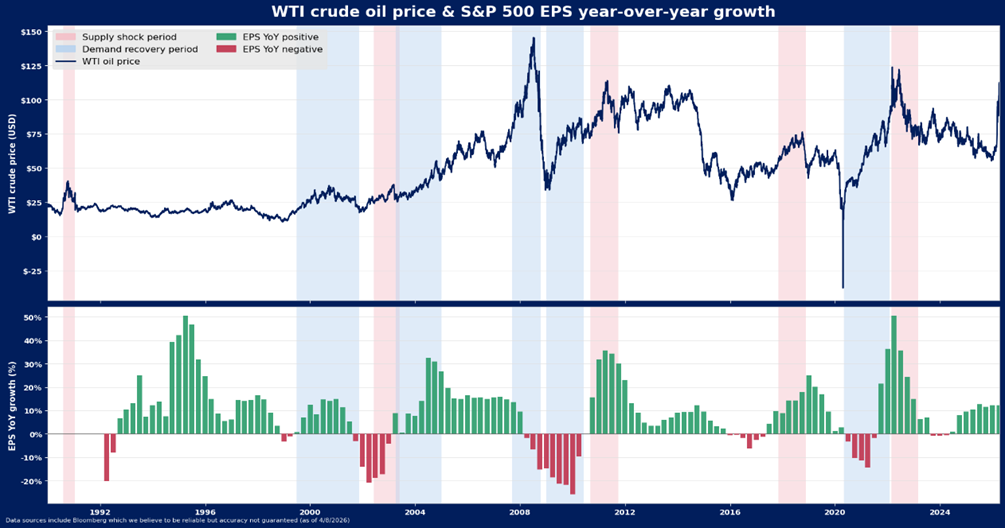
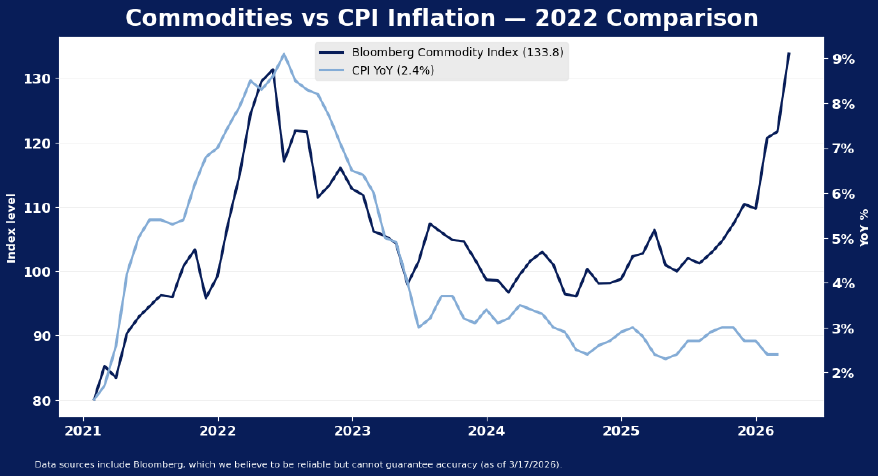
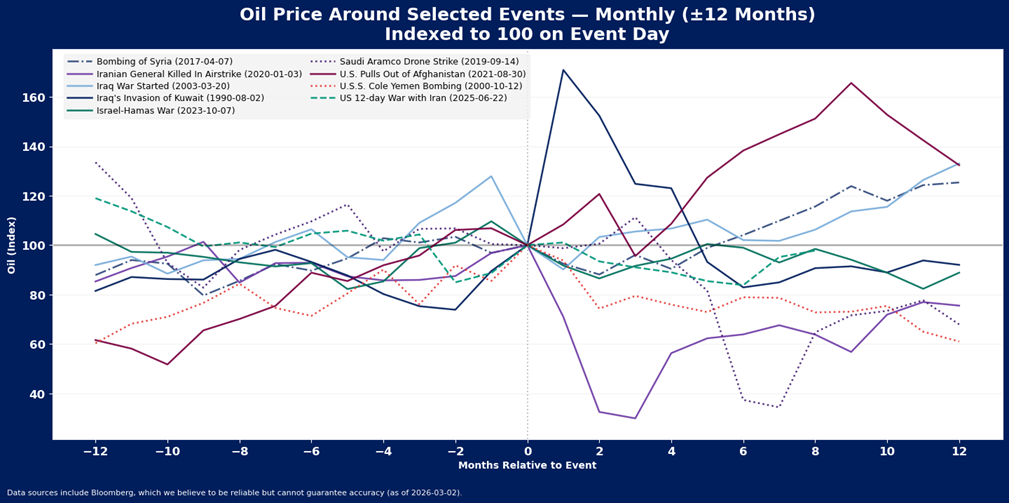
War in the Middle East and closure of the Strait of Hormuz has resulted in the largest spike in commodity costs since the start of the Russia-Ukraine war in 2022. Though the 2022 experience does not offer a perfect benchmark for what to expect this time, there are similarities in…
Though the headline decline in the S&P 500 of 3% over the last two weeks may at first appear benign, underlying supports for the index are fading fast, as war in the Middle East has depleted breadth at the stock and sector levels. While most investors are watching the price…
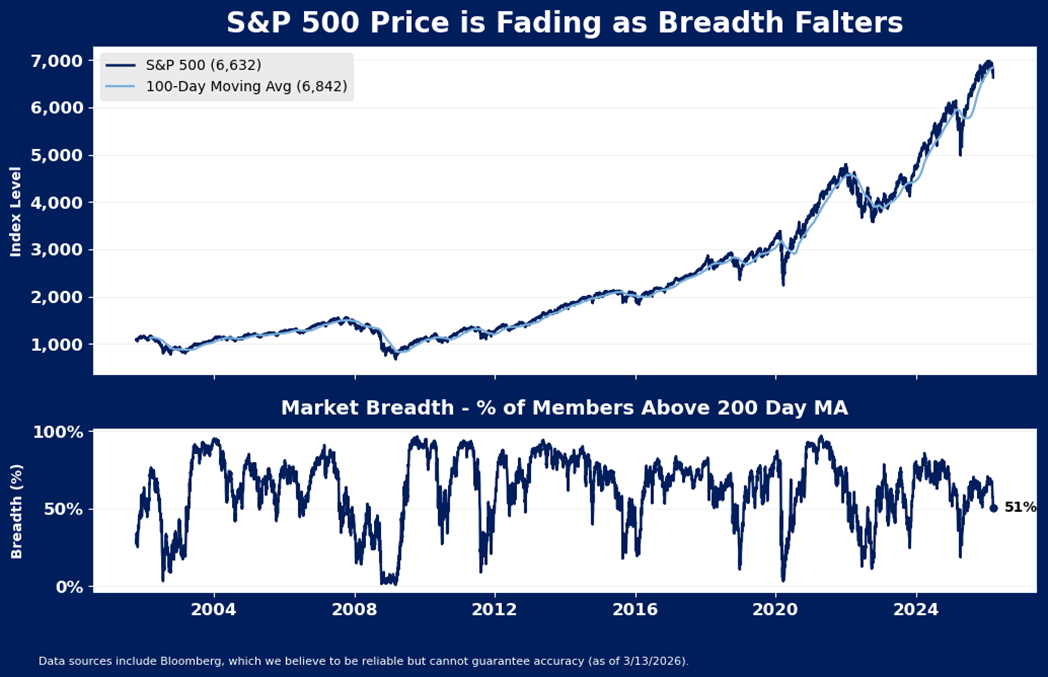
The S&P 500 has broken through key support at its 100-day and 20-week moving average for the first time in about a year, increasing the probability of a full correction in the index in coming weeks. There have been just 8 other instances when the market has broken down as…
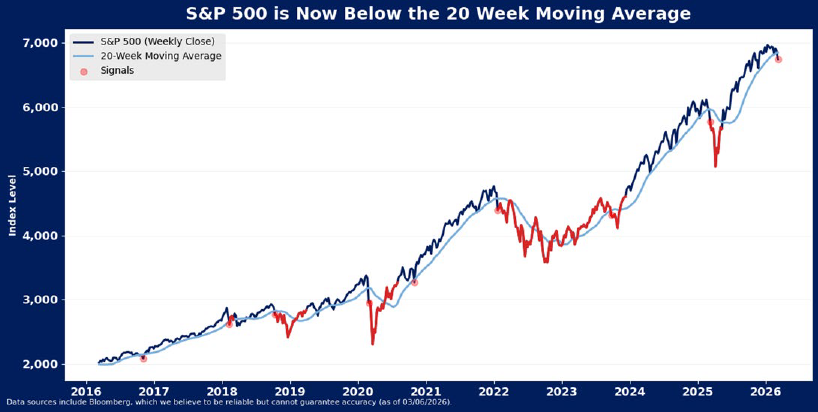
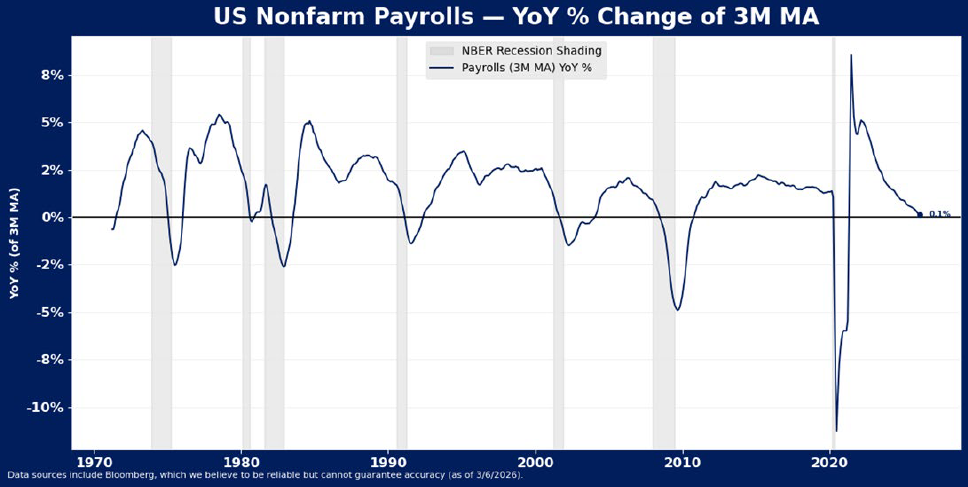
U.S. large cap stocks have broken down through the key 100-day moving average support level as the simultaneous gain in oil prices and deterioration in employment added to the AI-fears and private credit strains that have been nagging markets for months. It is extremely rare to see job losses and…
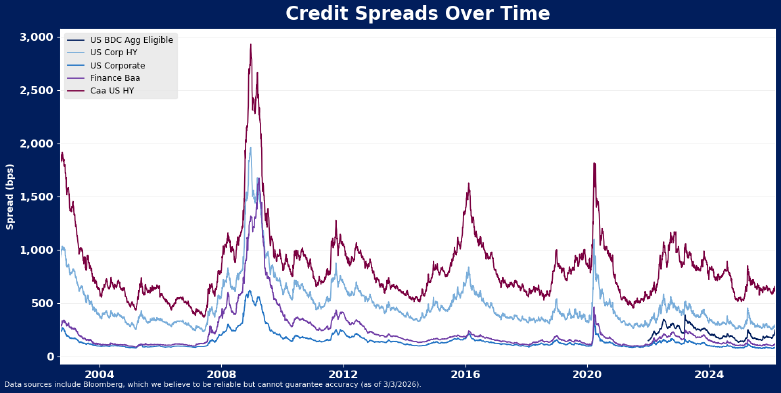
It is no secret that private credit redemptions are rising as concerns about default risk hamper performance of this most beloved asset class. As the “Golden Age” of private credit normalizes, we may continue to see liquidity pressures rise and questions about underlying loan valuations emerge. As financial markets remain…
Geopolitical risks may weigh on the outlook for stocks in the short run, with the S&P 500 now testing but so far holding a key support level at its 100-day moving average. Events in the Middle East have historically been absorbed fairly quickly by equities, unless oil prices spike and…
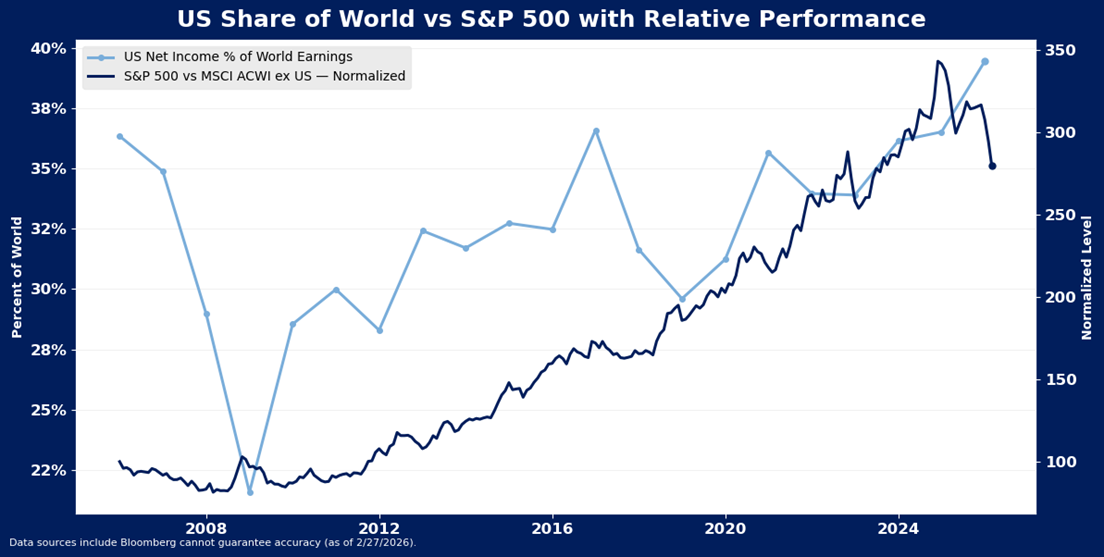
So far this year, 18 of the 19 largest country markets in the world are outperforming the US equity market. This vast outperformance is better than any start to the year since 2005, when all 19 markets outperformed the US. Yet, a persistent valuation gap between the US and the…
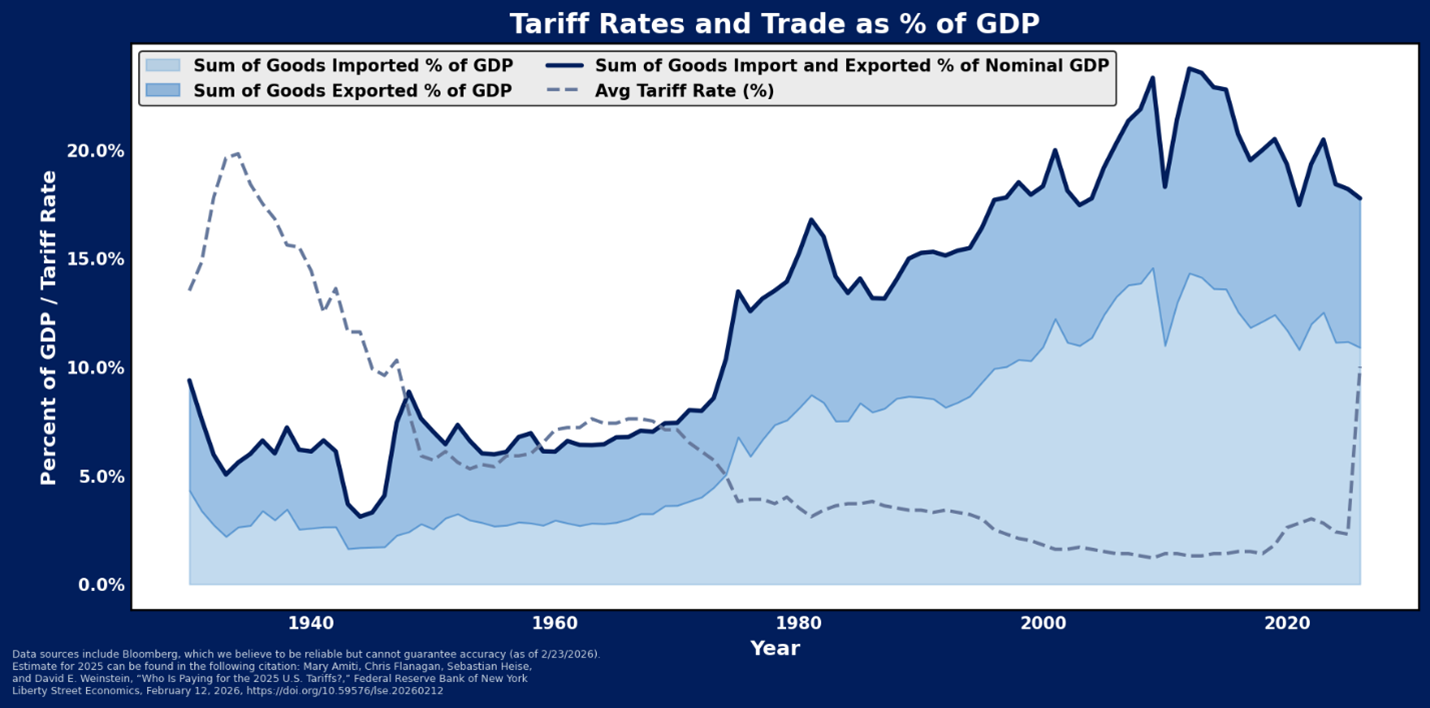
Trade policy may remain a source of anxiety for markets for some time to come. Contrary to consensus beliefs that tariffs were 2025’s issue, the Supreme Court ruling and resulting new tariff plans from the President suggest uncertainty is back and may challenge market assumptions for robust cyclical recovery in…
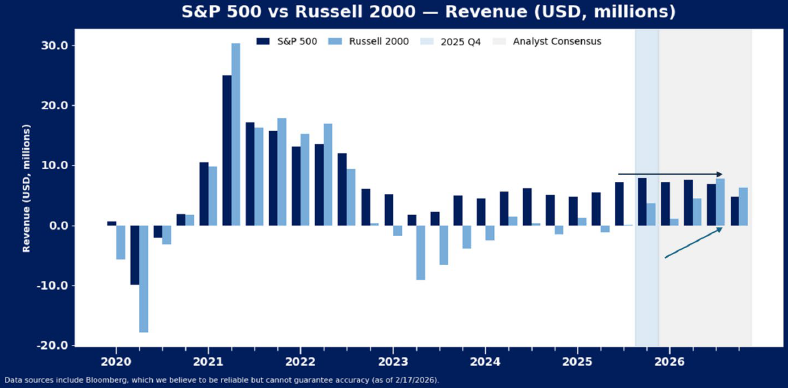
Earnings season is normally an uplifting experience for the S&P 500, but that has not been the case in recent weeks. On the surface, earnings appear fine, with the index on pace to post about 13% growth in earnings compared to the same period a year ago, and revenue rose…
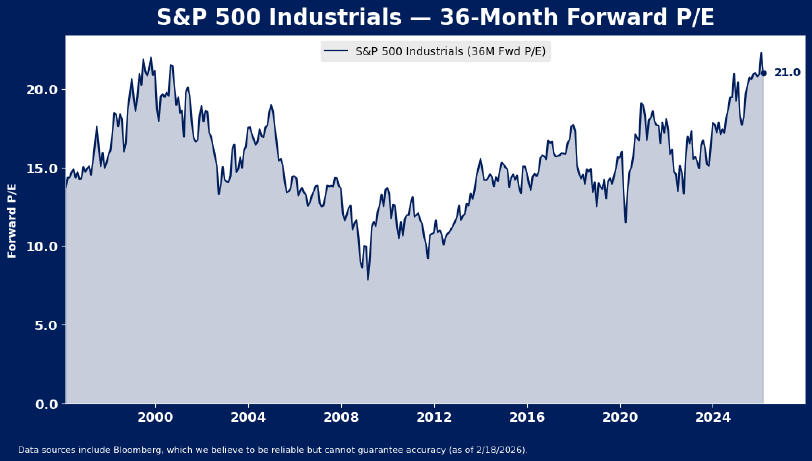
Recent data on durable goods orders and industrial production suggest an industrial recovery may be emerging for the economy, but industrials stocks may be expecting more of a full industrial renaissance. Large cap U.S. industrials have reached a new all-time high valuation relative to the S&P 500 index and now…
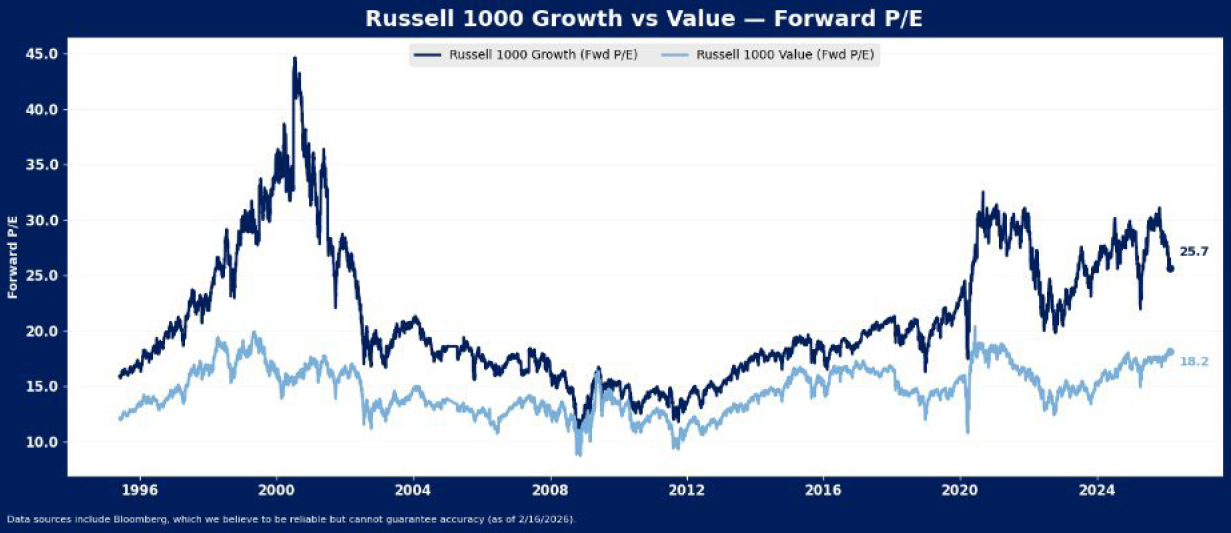
Recent rotation has helped resolve some of U.S. large cap stocks’ valuation excesses, but risks remain to the downside for U.S. multiples. Large cap growth’s sales multiple is still near its all-time high, at about 6X, and growth’s earnings multiple may still be at least 15% too rich to value….
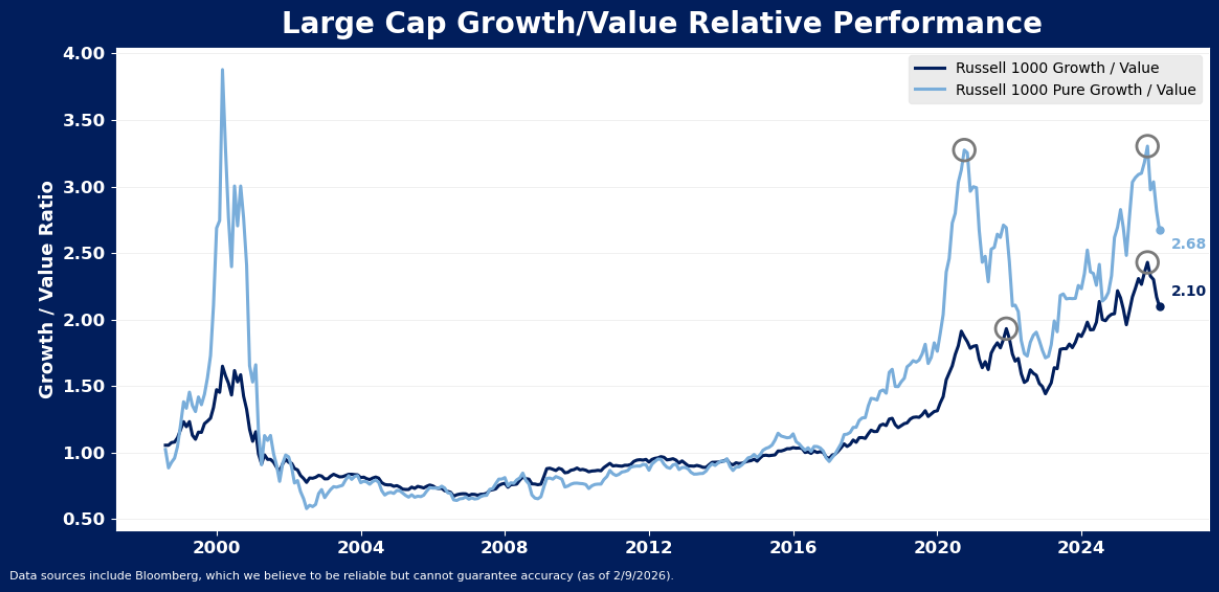
After outperforming for most of the last three years, growth stocks have been struggling relative to value stocks since October of last year. However, the broad indices may be masking a longer-term shift in the styles’ performance. Pure style indices and a look beyond large caps both suggest the growth…
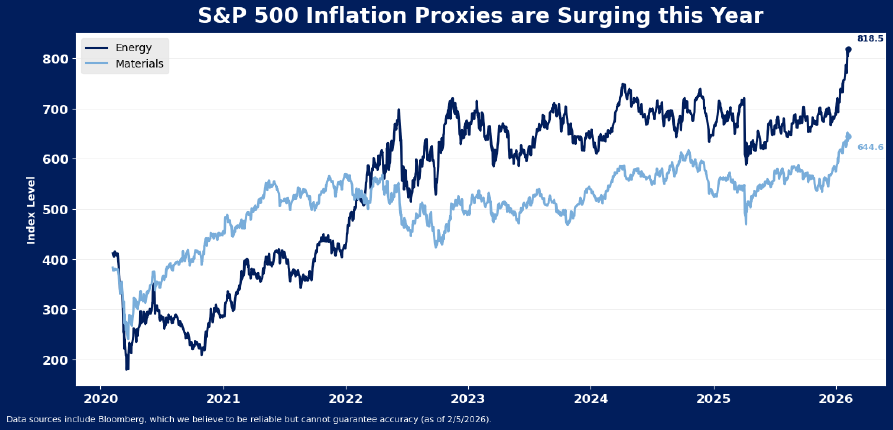
Elevated fiscal spending, easy monetary policy, trade tensions and geopolitical strains may imply inflation risk is re-emerging in 2026. This could take consensus views, focused more squarely on potential job losses as AI-initiatives are implemented, off guard this year. Materials and energy are two of the top performing sectors in…
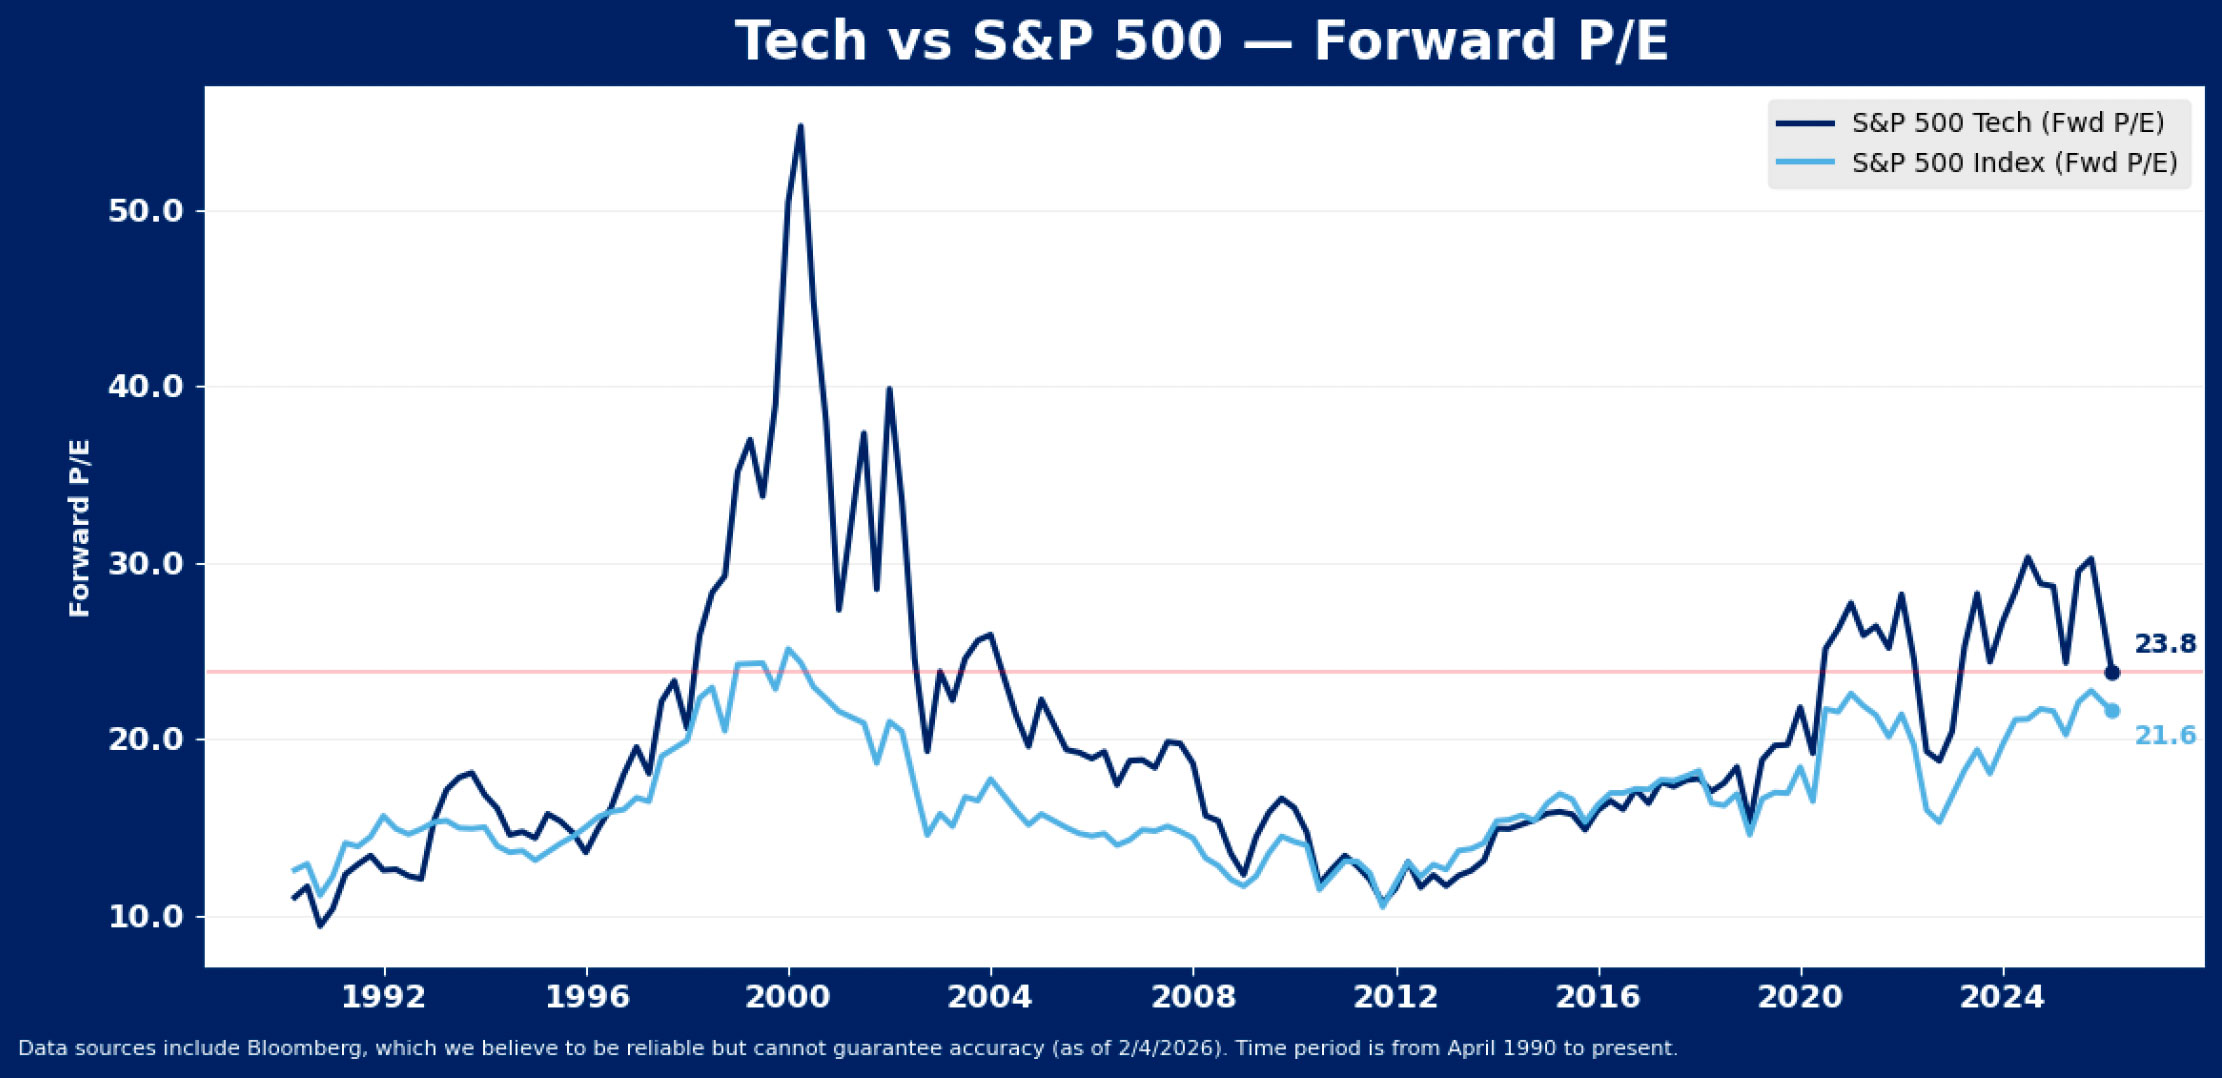
U.S. equity markets’ rotation out of technology has come a long way over the last few months, and the sector is now trading at just a 10% premium to the rest of the market. The sector’s earnings may justify a modest premium to the index, but only if growth can…
- « Previous
- 1
- 2
- 3
- 4
- Next »