


While strains from the conflict in Iran are already apparent in economists’ GDP forecasts, S&P 500 earnings estimates have hardly budged. The rub: GDP is heavily tilted towards consumption, increasingly at risk thanks to elevated oil prices, while earnings instead follow business investment. Thus, bottom-lines are likely to be revised lower but may not match the drop in GDP anytime soon.
Economic Forecasts Hit by War, Earnings Holding Up
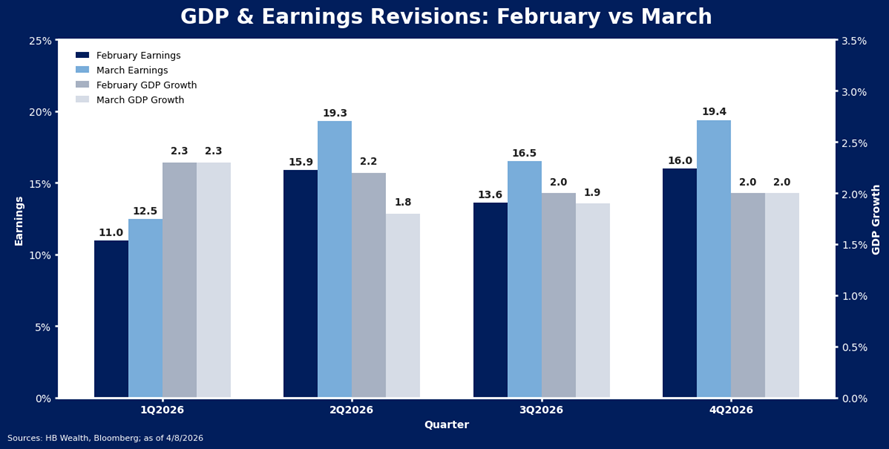
Economists are forecasting 2.3% real GDP growth in 2026, a modest acceleration from 2.1% last year, but have started slashing expectations for growth in 2Q and 3Q this year. The Bloomberg consensus of economists dropped their 2Q forecast to 1.8% from 2.2% just a month ago and nudged their 3Q forecast down to 1.9% from 2.0%. Meanwhile, analysts’ S&P 500 earnings forecasts rose. Over the last month, analyst expectations for 2Q and 3Q earnings growth rose to 19.3% and 16.5% from 15.9% and 13.6%, respectively.
Several things may explain the large divergence between economic growth and earnings forecasts. For a start, GDP is not particularly indicative of earnings trends. Even on a nominal basis, GDP growth is a highly imperfect indicator of profits. In fact, a single variable OLS regression suggests that only roughly 26% of movements in rolling year-over-year (YoY) trailing earnings growth are explained by YoY changes in nominal GDP. Our macro model uses other factors more indicative of earnings growth for this reason and has a more robust R-squared of 0.62. (see 4/8 note for our latest update on the model).
Consumer Drives the Economy but Tech Drives Earnings
Importantly, while earnings are largely driven by technology, the economy is driven by consumption. Higher for longer oil prices are already starting to impact the consumer outlook, eroding the boost from tax refunds this year – and this is likely weighing on the economic outlook more than the market outlook. So far, tax refunds are up 11% versus the same period a year ago, about $350 per filing, with about half of expected returns now filed. The IRS has paid out just over $200 billion so far this year. U.S. households will likely need to allocate some of that refund to covering higher energy costs. In 2025, households spent approximately $700 billion on energy in aggregate, when oil prices averaged ~$65/barrel (WTI). If oil averages 50% more this year, households’ energy bill will rise to closer to $770 billion, all else held equal, eliminating about 20% of the tax refund.
The bigger impact of high oil prices on stocks may come from the effect of elevated commodity costs on business investment trends. While consumption is still the bulkier category, at roughly 2/3rds of GDP, it grew just 2.6% in 2025, its slowest pace in the post-pandemic recovery, and is expected to rise only 2.1% in 2026. Business investment is meanwhile expected to grow at a faster pace of 2.7%, supported by the combination of equipment, software, and infrastructure investment, up 11% last year and is likely to grow faster in 2026 as topline growth for AI-related segments accelerates. This investment is the bigger driver of profits in the S&P 500. About 40% of index EPS this year is expected to be generated by the tech and communications sectors, and another 11% may come from industrials and materials. Consumer sectors together, including mega-caps Amazon and Tesla, are meanwhile expected to be just 12% of index earnings.
Non-Domestic Exposure and Energy Sector Also Play a Role
The S&P 500 is also more globally oriented than the U.S. economy. While just 10% of U.S. economic growth comes from exports, about 30% of S&P 500 sales come from outside of the United States, furthering the divide between economic measures of output and earnings trends on the index. Likewise, over 40% of S&P 500 cost of goods sold (COGS) are sourced from overseas which could cause the economy and earnings to decouple further, especially should the war in Iran resume. That conflict had already driven Brent crude to trade nearly $17 per barrel above West Texas Intermediate (WTI) prices before normalizing ahead of rumored ceasefire talks – making non-domestic inputs even costlier. In contrast, imports of goods and services were 13.8% of US GDP in 2025 based on data from the Federal Reserve.
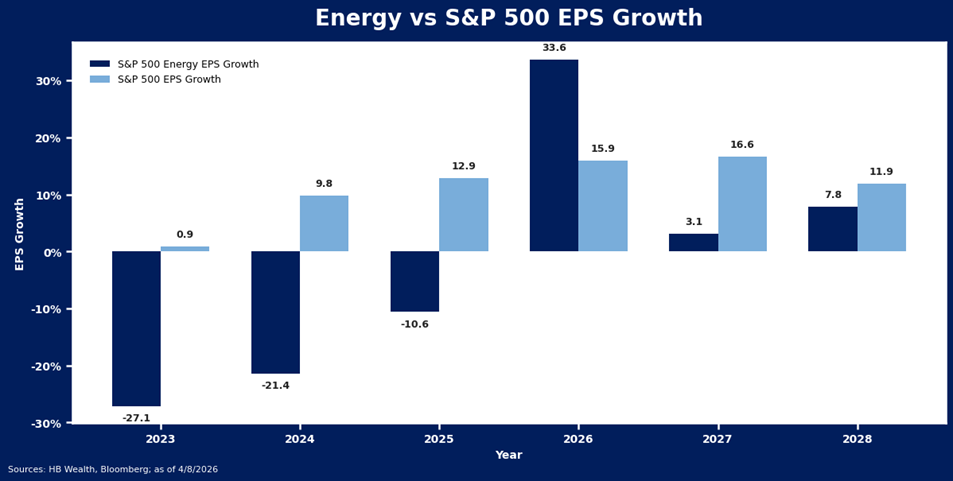
Finally, very large swings in the profitability of energy companies can also have outsized impacts on the earnings stream during periods of oil and gas price surges. Even though energy is a very small share of the market (about 5%), energy sector earnings swings are so violent that they can mask trend shifts in other sectors. After three straight years of declining profits, analysts forecast energy companies may record 25% EPS growth this year on account of the price recovery, a 35-percentage point swing from a 10% drop in EPS in 2025.
Conclusion
GDP is a highly imperfect signal for profits, as it is heavily skewed to consumption and more domestically oriented than the largest companies in the United States. Thus, while it looks increasingly likely that S&P 500 earnings will decelerate on account of higher energy prices in the short term, it is highly unlikely that profits will match the pace of broader economic conditions. Though the direction of change will be somewhat consistent, we can expect large divergences between U.S. GDP and S&P 500 earnings growth to remain.
Disclosure: HB Wealth is an SEC-registered investment adviser. The information reflects the author’s views, opinions, and analyses as the publication date. The information is provided for informational purposes only and does not constitute an offer to sell or a solicitation of an offer to buy any investment product. This information contains forward-looking statements, predictions, and forecasts (“forward-looking statements”) concerning the belief and opinions in respect to the future. Forward-looking statements involve risks and uncertainties, and undue reliance should not be placed on them. There can be no assurance that forward-looking statements will prove to be accurate, and actual results and future events could differ materially from those anticipated in such statements. The information does not represent legal, tax, accounting, or investment advice; recipients should consult their respective advisors regarding such matters. Certain information herein is based on third-party sources believed to be reliable, but which have not been independently verified. Past performance is not a guarantee or indicator of future results; inherent in any investment is the risk of loss.

