Abstract:
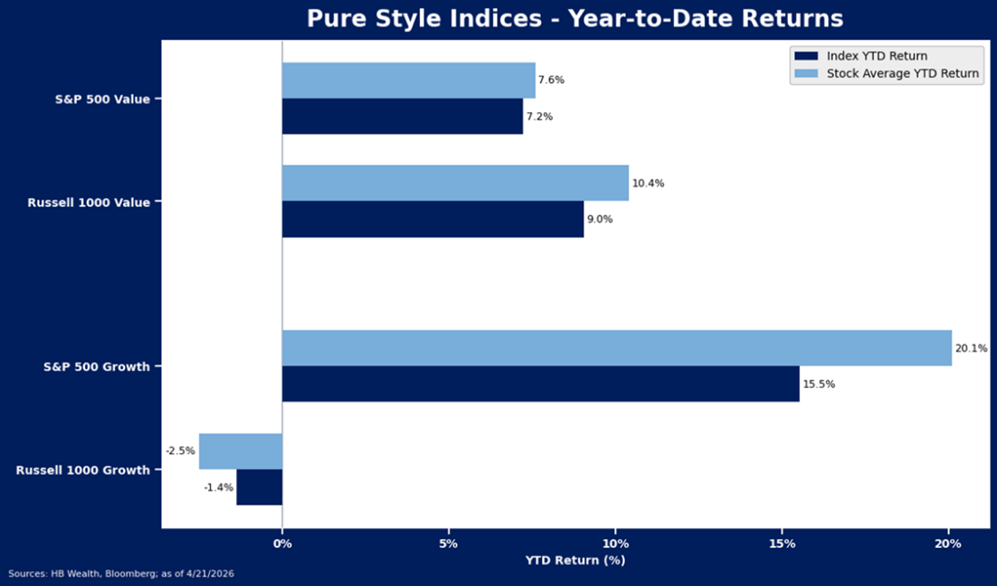
- The recent rally in large cap growth stocks is narrow – in the broad large cap Russell 1000, the average growth stock is still down 2.5% this year even as the average S&P 500 growth stock is up 20%+.
- Growth performance is on the back of few while value has the support of many. Just 37% growth stocks in the Russell 1000 are up so far this year, versus 67% of value stocks.
- Value stock multiples remain discounted and may continue to close the gap with growth.
Value Has Supports that Growth Lacks
The largest of large cap growth stocks have roared back from late-March lows as investors have gravitated back to perennial favorites on the presumption that recovery from war-time strain may prove similar to recovery from tariff-policy stress. However, there is an underlying weakness in the growth style this time – the biggest stocks in the U.S. have gobbled up the bulk of large cap growth stocks’ gains, and the average growth stock is still down year to date. Meanwhile, the opposite is happening in value, where the largest stocks have lagged broader gains for the rest. Therefore, value has something growth doesn’t have in 2026 – broad participation in the rally.
Despite April Bloom, Growth is Still Struggling with a Bear Market
Since the March 30 low in stocks, the S&P 500 Pure Growth Index has surged 20.6% to land at an all-time high. However, broader large cap growth – represented by the Russell 1000 Pure Growth Index – is still lagging and remains 3.1% below its October 2025 peak. A large gap has developed between the largest growth stocks and the rest. The average S&P 500 growth stock (representing the largest of the large) is up 20.1% so far this year, while the average Russell 1000 growth stock is down -2.5%. Likewise, 61.5% of stocks in the S&P’s index are above the level where they started this year, but only 36.7% of Russell’s Growth stocks have posted a gain year to date. (Both S&P 500 and Russell Growth and Value indices have large constituent overlap. Thus, for purposes of analyzing growth and value as distinctly separate groups, we look at the Pure Growth and Value indices. These indices have no overlapping constituents between growth and value, and thus represent a clear, or “pure” take on style dynamics).
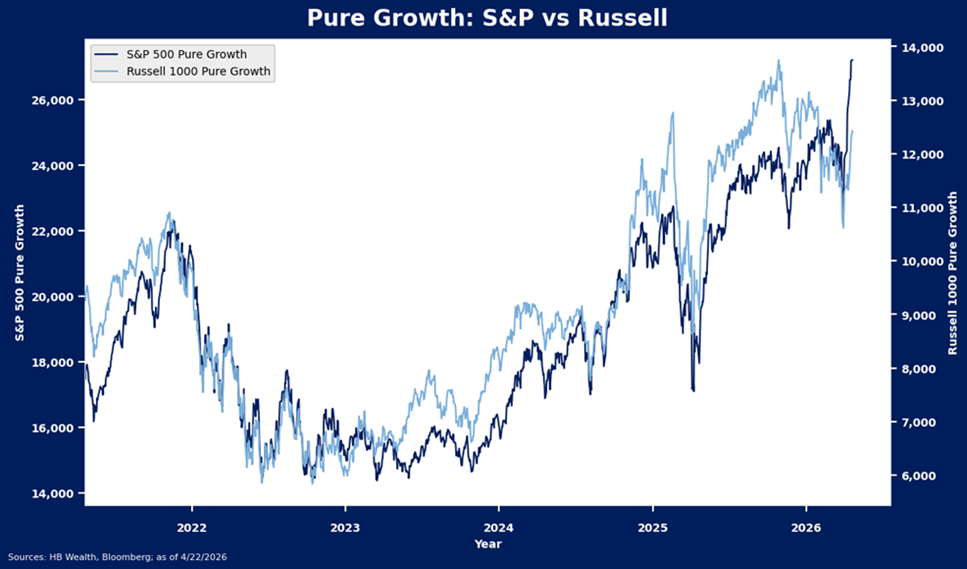
Breadth is to blame for the unusually large performance divergence between the S&P 500 Pure Growth and Russell 1000 Pure Growth indices. More than 60% of stocks in the S&P 500 version are back above their 200-day moving average while a mere 32% of growth stocks in the Russell 1000 has managed the feat. This suggests what appears to be a strong surge in growth stocks is actually quite a narrow recovery in the largest growth stocks among U.S. large caps.
The duration of poor breadth inside the broader growth index is a potential signal of an underlying bear market in the style that is being obscured by strong performance of heavy market cap stocks. Less than half of Russell 1000 Pure Growth stocks have been above their 200-day moving average since January 8th of this year, the longest streak since 2022 and consistent with a bear market in growth stocks. The only other periods in which the group has recorded such low breadth for so long were during the corrections of 2018 and 2022. In both of those experiences, value stocks outperformed growth, and growth stocks fell into a bear market.
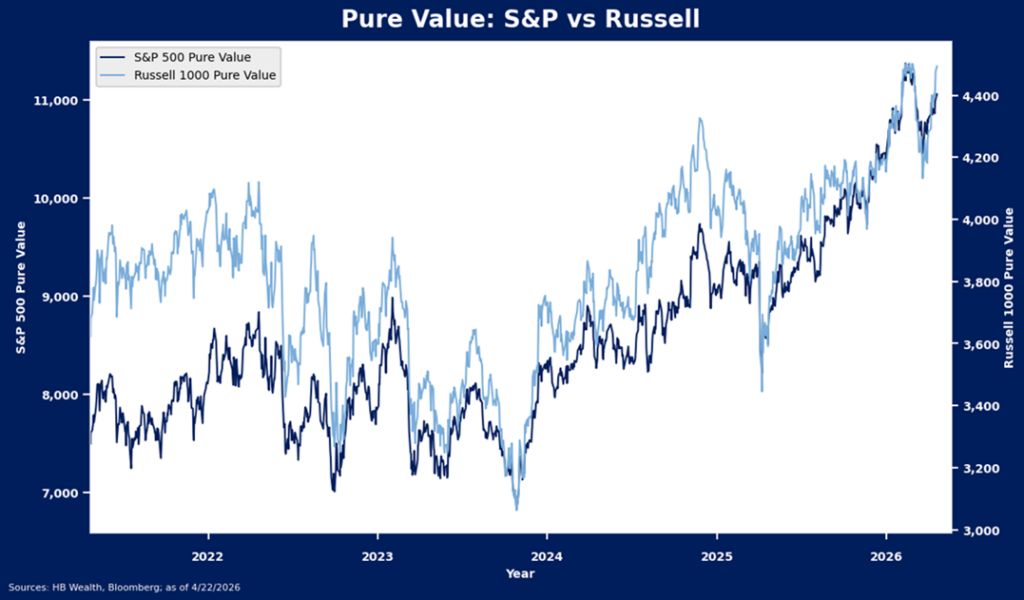
Meanwhile, Value is Quietly Accumulating Support in an Uptrend
While large cap growth stocks may still be struggling with a bear market, value stocks’ bullish advance may have only taken a pause with the wartime trade dominating equity markets. In contrast to the dynamic driving growth indices, the broader value index shows slightly stronger performance than the index more heavily dependent on the biggest stocks. The Russell 1000 Pure Value Index is testing all-time highs touched in February while the S&P 500 version is still 3.2% below its early 2026 peak. The average S&P 500 value stock is up 7.6% so far this year while the average Russell 1000 value stock is up 10.4%.
Given the market cap impact on performance for both S&P 500 and Russell 1000 indices, leadership by many rather than the few large stocks can appear like a weaker uptrend, but it is arguably more durable due to broader participation. Both the S&P 500 and Russell 1000 Pure Value indices show strong participation in the uptrend, with nearly 70% of constituents in each index trading above their 200-day moving averages. Currently, 67.8% of the S&P 500 Pure Value Index stocks are above the levels where they started the year, similar to the 67.6% of constituents in the Russell 1000 version.
Valuations Still Favor Value Over Growth
Recent bounce notwithstanding, the bear market for growth stocks may continue until the growth premium normalizes. Even with the adjustments so far this year, the premium for growth stocks remains extreme, suggesting markets are priced for extraordinary growth – likely well beyond consensus expectations – this year. By the end of last year, the S&P 500 pure growth index was trading at 31.4X forward earnings, or 2.25X forward earnings multiples for value stocks. That premium has edged lower to 2.1X but remains above pre-pandemic norms. From 2011-2019, the premium averaged about 1.5X, about the level where the style found its legs again in the 2022 market correction.
With the downdraft in Russell 1000 growth multiples since early 2025, growth has dropped to the lower end of its recent forward P/E range, but at forward P/E of just under 30X, index valuation remains above pre-pandemic norms closer to 26X, suggesting there remains some risk to multiples in the growth space, particularly if earnings disappoint. Meanwhile, value stocks’ multiples have been somewhat stuck in a tight range for years, and at 13X forward earnings continue to trade well below prepandemic norms of 20+. As value remains out of favor, expectations present considerably lower risk to the style.
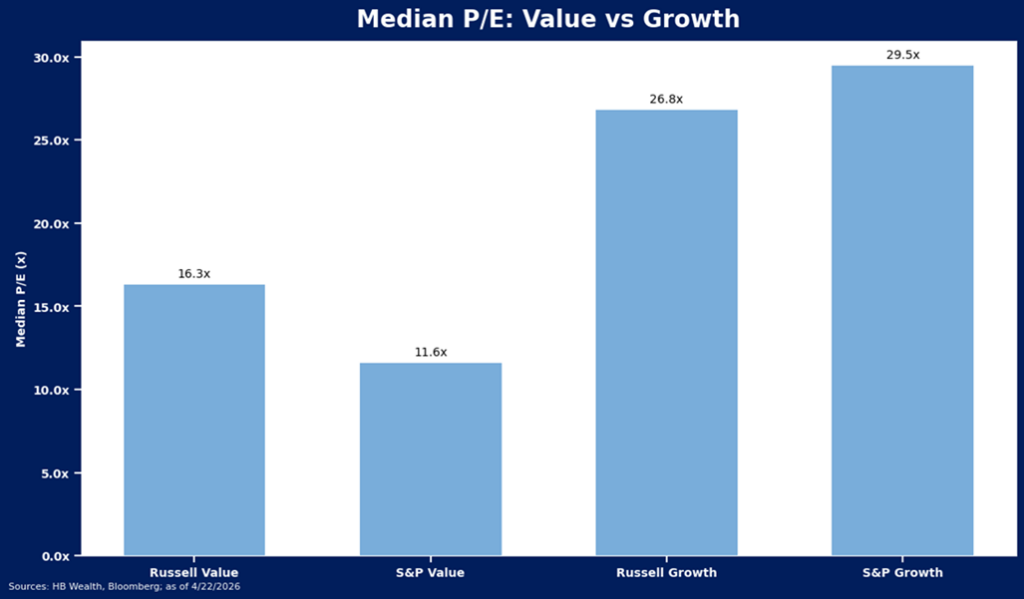
The valuation gap continues to be amplified by size, as investors have crowded into the largest growth stocks and out of the largest value stocks. The median pure growth stock in the Russell 1000 is still priced 10.5X times above the median pure value stock in the index, still high and commanding a 26.8X forward P/E versus 16.3X. However, the gap between growth and value is even greater in the index more concentrated in mega caps. The median pure growth stock in the S&P 500 is still priced 17.9X times above the median pure value stock in the index, commanding a 29.5X forward P/E versus 11.6X.
Disclosure: HB Wealth is an SEC registered investment adviser. The information reflects the author’s views, opinions, and analyses as the publication date. The information is provided for informational purposes only and does not constitute an offer to sell or a solicitation of an offer to buy any investment product. This information contains forward-looking statements, predictions, and forecasts (“forward-looking statements”) concerning the belief and opinions in respect to the future. Forward-looking statements involve risks and uncertainties, and undue reliance should not be placed on them. There can be no assurance that forward-looking statements will prove to be accurate, and actual results and future events could differ materially from those anticipated in such statements. The information does not represent legal, tax, accounting, or investment advice; recipients should consult their respective advisors regarding such matters. Certain information herein is based on third-party sources believed to be reliable, but which have not been independently verified. Past performance is not a guarantee or indicator of future results; inherent in any investment is the risk of loss.