Abstract:
- The tech sector has become less expensive since the start of the year, but discounts are concentrated largely in software, and implied expectations for highly coveted names are still extreme.
- Consensus forecasts for growth are still climbing, even for at-risk software stocks. That’s driving steep forward discounts that rely on clearing consensus’ bar to represent the group’s “true” discount.
- Software’s discount versus tech is now 2.4 standard deviations below recent norms but headline risks around AI make entry timing difficult.
- The highest valuation tech stocks also have the highest growth forecasts. This may make earnings season a big challenge for the most beloved names in tech.
Discounted forward valuations are giving some investors the impression that the tech sector is much cheaper than reality. While it’s the one undoubtedly cheap segment in tech, software terminal value risks from AI make risk taking difficult in aggregate even if company opportunities exist. Meanwhile, the highest multiple stocks in tech carry the highest growth forecasts as investors chase fundamental hopes and dreams, possibly setting up a challenging earnings season for tech. Reaping a reward will hinge on companies’ ability to beat robust forecasts for growth – an increasingly tall task.
Tale of Two Multiples – Forward and Trailing Views Diverge
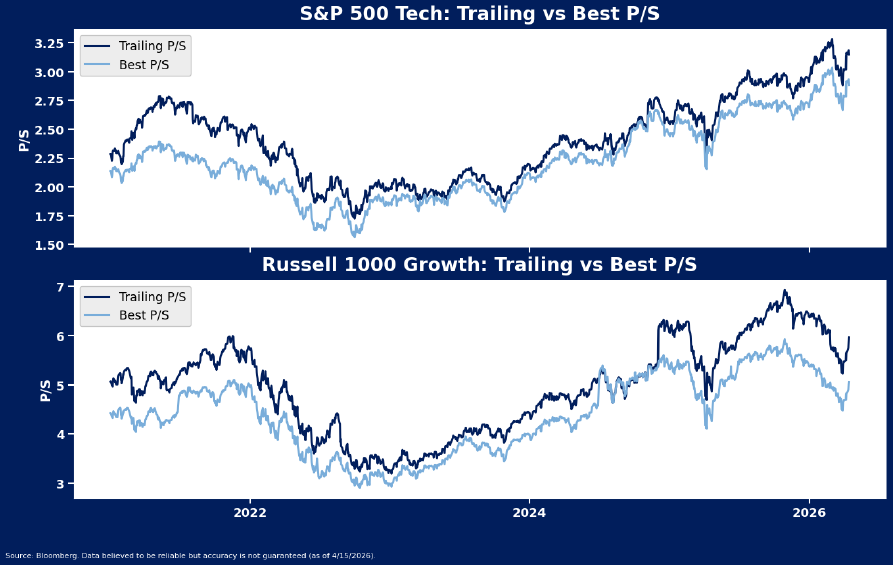
Tech multiples have eased off from recent extremes, but a notable gap between forward and trailing valuations has emerged that may keep sector momentum somewhat constrained in the near term. Currently, lofty consensus forecasts are causing a large divergence between forward and trailing multiples for both tech and growth stocks at large, suggesting that consensus estimates might be a bit too high. This contrasts heavily with typical behavior at major lows for the sector.
On an absolute basis, tech trades at a trailing 9.4x sales and a forward 7.1x. This is 1.1 and 0.3 standard deviations above the average back to 2020, respectively. Likewise, the Russell 1000 Growth Index is at 5.9x and 4.9x trailing and forward multiples, 1 and 0.6 standard deviations above the norm, respectively. The gap between the two multiples is stretched, at 2.3 turns for tech and 0.9 turns for the growth style – just south of the 2.4-turn and 1.1-turn respective apexes from March.
Periods of true tech sector capitulation since-2020 (like the 2022-23 bear market low and 2025’s liberation day) coincided with a convergence in forward and trailing multiples. In those experiences, forward and trailing tech sector multiples got within at least one turn of each other, signaling an optimistic turn for stocks.
Despite geopolitical tensions, the SaaSpocalypse, and an already high bar to kick off 2026, consensus revenue forecasts have continued to climb – artificially deflating forward multiples but also raising the risk of volatility around reporting season as companies struggle to clear sky high expectations. Since the start of the year, tech’s 2026 and 2027 revenue growth forecasts have climbed to 25.5% and 16.7%, respectively, led by the semis industry. Even software – facing concerns that AI might derail the seat model and lower barriers to competition in the space – is facing a slightly higher revenue bar than the start of the year. Only very early 2028 estimates have been cut for portions of tech – semis’ forecast for sales growth that year is down 32 bps while software’s estimate is off by 9 bps over the past month. Tech Industries Show Wide Valuation Spreads The S&P 500 tech sector is no longer valued like one ubiquitous block as investors have crowded into specific industries and high sales growth segments of the index, putting elevated pressure on these groups to outperform expectations during quarterly earnings seasons. Meanwhile, discounts are few and far between and concentrated in the lowest growth segments.
On a forward price/sales basis versus the sector, communications equipment, electronic equipment and semis carry relative multiples well above the 2021-26 average. Conversely, software (2.5 deviations below 5-year norms) is the cheapest segment as investors discount their terminal value to account for AI-related fears. IT services and hardware are the only other groups trading below recent averages relative to the sector.
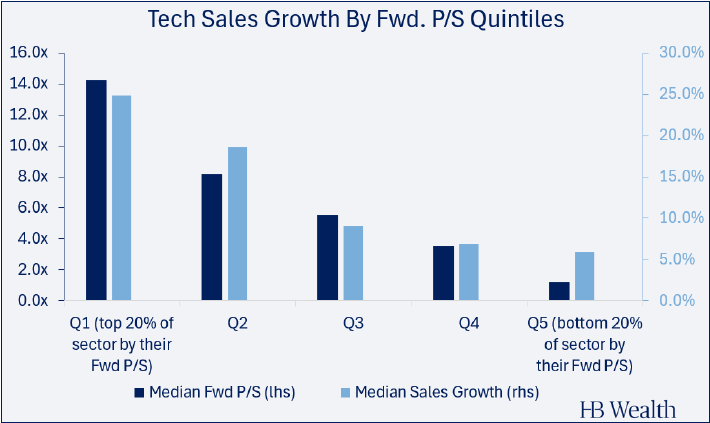
Meanwhile, the most expensive companies in the sector on a forward price/sales basis also carry the highest revenue growth forecasts, hinting that the market is priced for even more than robust sellside consensus suggests for these stocks and possibly creating a volatile backdrop for earnings reports. The top quintile (20%) of stocks ranked by their sales multiple carries a median 13.7x forward price/sales and is expected to post median 24.9% sales growth over the next year. The second most expensive quintile of tech stocks is expected to post median sales growth of 10%, still about double growth for the rest of the sector.
Conversely, the cheapest cohort of tech stocks (median 1.2x sales) is forecasted to post growth at just a 5.9% clip. While much of this group is beleaguered hardware, software and services entities, their sales pace is nearly as fast as the rest of the stocks in the bottom half of tech, and yet multiples are less than half.
Disclosure: HB Wealth is an SECregistered investment adviser. The information reflects the author’s views, opinions, and analyses as the publication date. The information is provided for informational purposes only and does not constitute an offer to sell or a solicitation of an offer to buy any investment product. This information contains forward-looking statements, predictions, and forecasts (“forward-looking statements”) concerning the belief and opinions in respect to the future. Forward-looking statements involve risks and uncertainties, and undue reliance should not be placed on them. There can be no assurance that forward-looking statements will prove to be accurate, and actual results and future events could differ materially from those anticipated in such statements. The information does not represent legal, tax, accounting, or investment advice; recipients should consult their respective advisors regarding such matters. Certain information herein is based on third-party sources believed to be reliable, but which have not been independently verified. Past performance is not a guarantee or indicator of future results; inherent in any investment is the risk of loss.