Abstract:
- Small caps have more than doubled returns of large caps this year. The Russell 2000 is likely to continue to perform well in 2026, thanks to still-discounted valuations and several emerging catalysts.
- Revenue forecasts suggest small caps could narrow the gap with faster-growth large caps, making it difficult to justify paying an enormous premium for the S&P 500.
- Macro and policy trends could be turning in favor of small caps, unless higher oil prices derail or delay recovery. Manufacturing gauges are in expansion for the first time in years, fiscal policy is supportive, and the Fed may resume their rate-cut path later this year. Tariff policy is less of a drag than it was in 2025.
- M&A activity is surging along with deal premia. That’s helping a wide swath of the Russell 2000 rerate higher.
Russell 2000 Is Getting Sparks from Revenues, Macro and M&A
Small cap stocks have long been discounted to the S&P 500 as mega-cap dominance now extends back nearly a decade. However, in 2026, the Russell 2000 is finally getting the sparks it needs for a period of outperformance – provided high oil prices don’t derail or delay recovery trends. Topline appears poised to surge following nearly three years of intermittent revenue recession while supportive fiscal and monetary policy take hold. Likewise, the manufacturing economy might just be turning up just as 2025 headwinds from tariff policy ease. M&A deals and premia have likewise surged, aiding a wide swath of the Russell 2000.
Small Caps’ Deep Discount Primed the Pump for Outperformance
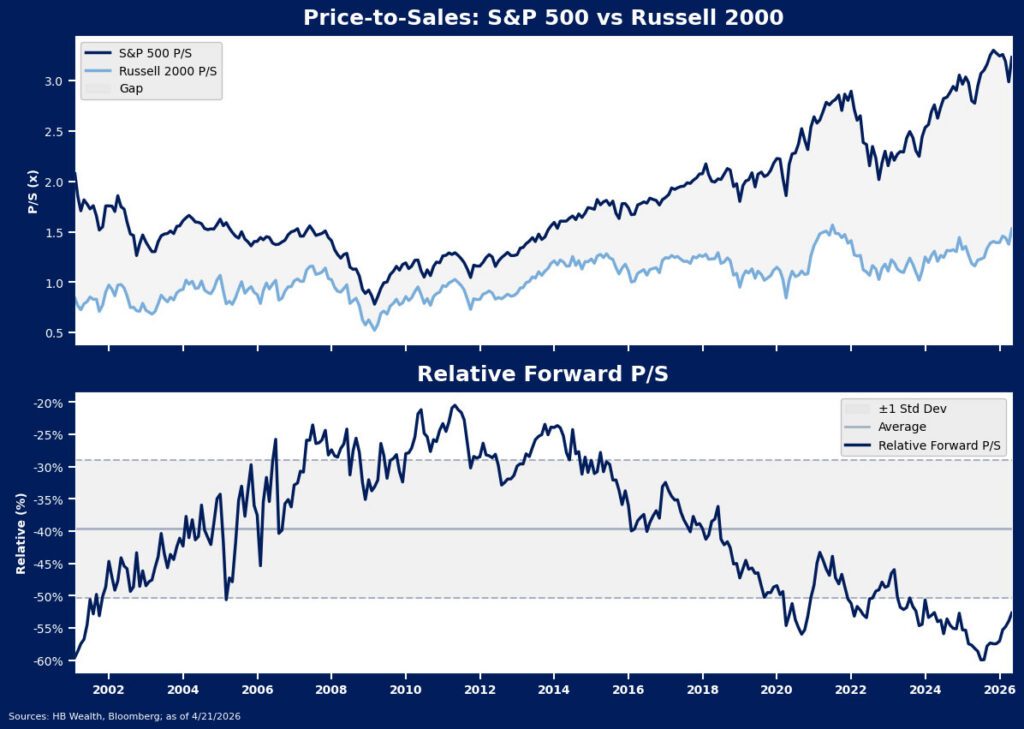
The Russell 2000’s steep relative discount to the S&P 500 primed the size for its sharp outperformance so far in 2026 and even though small caps have more than doubled the return of large caps, the gauge is still historically cheap compared to large caps. This gives it a long runway for outperformance. At 1.5x price/forward sales – our preferred valuation metric for small caps given its sizable unprofitable cohort – the Russell 2000’s absolute multiple is near the top of its range, akin to the 1.6x it commanded in 2021 when easy monetary policy and fiscal stimulus drove significant small cap outperformance during the recovery from the Covid-19 recession. However, on a relative basis, the size trades at a 52.7% discount to the S&P 500. This is 1.2 standard deviations below the average since 2000.
Small Caps’ 2026 Tailwinds – Revenue Estimates, Manufacturing Turnaround and M&A
Discounted relative multiples alone aren’t enough to make a compelling case for small-cap outperformance, but several catalysts have emerged to spark a re-rating for the segment this year. So far, strong consensus bottom-up revenue forecasts, improving macroeconomic conditions, and a pickup in mergers & acquisitions (M&A) have acted as catalysts in 2026 and may continue to do so until valuations normalize or these tailwinds abate.
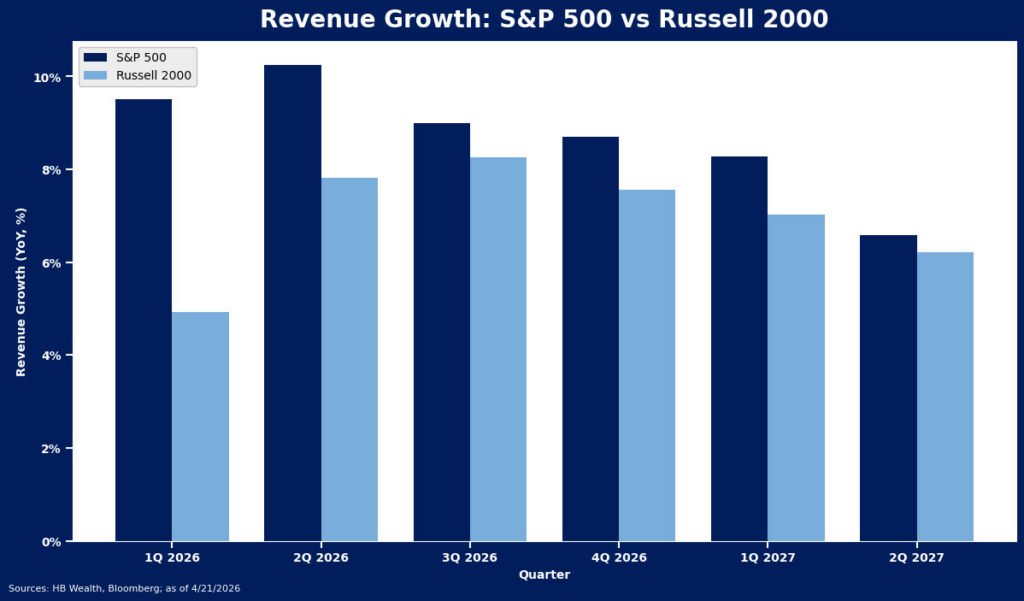
Revenue forecasts through mid-2027 lay stocks’ new reality bare – analyst estimates for small- and large-caps are converging, making it difficult for investors to pay nosebleed-level premiums for the latter, and spurring rotation into the Russell 2000. While the S&P is expected to enjoy a 4.56 percentage point revenue growth lead in 1Q over the Russell 2000 on a current constituent basis, that gap is expected to narrow through 1H27, reaching just a 0.36 percentage point spread by 2Q27. Though revisions have been more favorable toward large caps (up an average 1.5 percentage points over the past three months from 1Q26-2Q27), small caps (up an average 0.5 percentage points) are facing hikes of their own – a marked change from other recent false-starts for the size. Likewise, revenue gains are driving a sharp earnings turnaround with the Russell 2000 pegged for 43.7% net income growth versus 17.9% for the S&P 500 in 2026. Higher for longer oil prices remain a risk to smaller cap margins, but the improving revenue backdrop is encouraging.
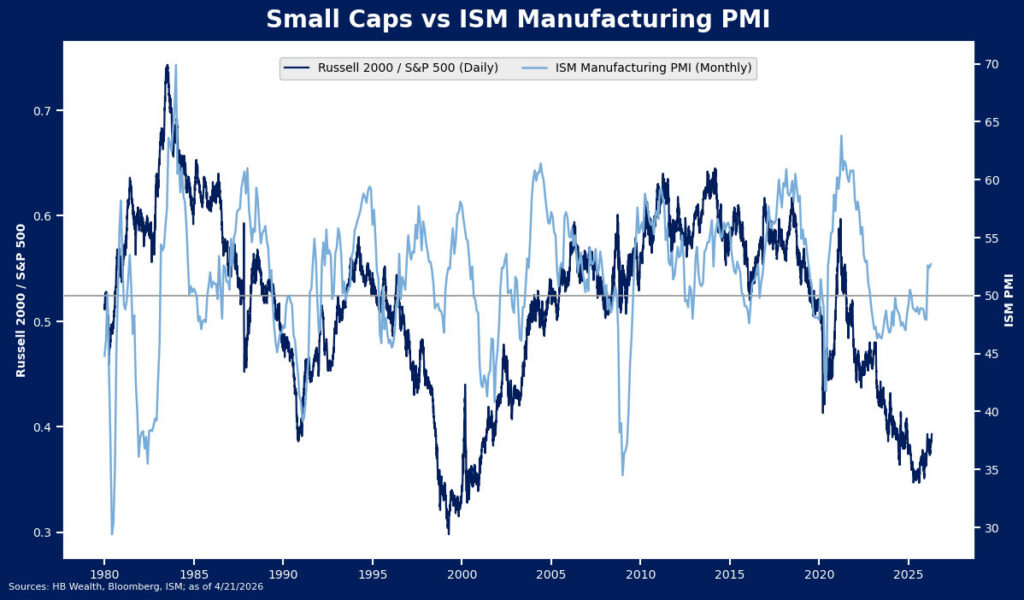
Macroeconomic conditions are similarly starting to break in favor of the more economically sensitive Russell 2000. The ISM Manufacturing Purchasing Managers Index (PMI) had been in contraction (below 50) most of the time since November 2022 – marking the longest stretch back to 1980 without a meaningful expansion. However, PMI has surged to 52.7 with the latest reading from March – one of the reasons our economic cycle model rose to 0.74. Since 1979, there have been 12 instances (including the current) where ISM’s Manufacturing PMI fell to 48 or below, and in the year following the gauge’s return to lasting expansion (above 50), the Russell 2000 gained an average 20.9%, topping the S&P 500 70% of the time.
Policy cues that benefit small caps are also emerging in 2026. First and foremost, is the prospect for renewed Fed rate cuts in the second half of the year. This is one of the major reasons why small caps fell sharply on the conflict in Iran and the prospect of energy-driven inflation as traders priced-out rate cuts this year. Companies in the Russell 2000 tend to face higher costs of debt capital than larger peers, making lower rates a significant catalyst for outperformance. Thus, a quick resolution to the conflict that gives the Fed wiggle room to lower rates as originally planned will be critical to success. Second, a wave of fiscal stimulus as a result of One Big Beautiful Bill tax cuts is driving optimism toward more economically sensitive stocks like small caps. While higher oil prices will likely blunt at least some of the positives for consumers, direct expensing for business investment may continue to support spending growth. Lastly, the Supreme Court’s rejection of the administration’s tariff-making power under the IEEPA has already resulted in lower effective tariff rates than those faced in 2025. Tariffs disproportionately disrupted small caps that lacked the pricing power of their larger peers.
Mergers and Acquisitions (M&A) have also been an underappreciated driver of small cap outperformance this year and at least based on early 1Q results, company managements are exuding confidence about deals going forward. M&A activity had been slow in the first several years after the pandemic but started to materialize in the back half of 2025. This coincided with the turn in small cap relative performance.
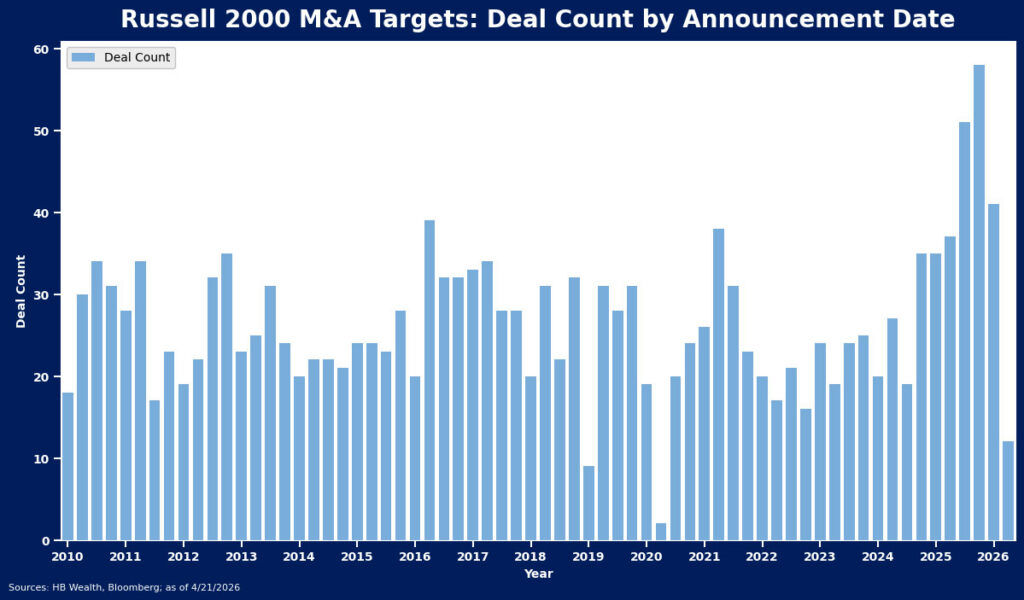
Deal premia help set a valuation standard for the takeout target’s peer group – part of the reason that since June, telecom (up 104.7%) has led the Russell 2000. That group has seen significant targets with 13 companies facing a proposed deal with an average premium to week prior to announcement price of 47%. Health care (up 40.5%) has had the largest number of targets (34) and the biggest average premium (48.2%) with tech (up 31.2%) third with 23 targets at an average premium of 29.9%.