








Economy is Still on Solid Footing; Inflation is the Biggest Risk
Most signals confirm that strong AI-related business investment is keeping the US economy on solid footing, with the biggest risk to the outlook still persistently high inflation. Leading indicators were mixed in August. Manufacturing continued its year-to-date resurgence, with the ISM PMI hitting the highest level in over four years in August while consumer sentiment remained grim due to elevated prices and geopolitical strains. Backward looking data showed that despite the onset of war in the Middle East, 2Q GDP managed a gain of 1.5% thanks to tax-refunds’ support for consumption and surging AI investment. Employment generally remained stable over the summer, with the unemployment rate dropping to 4.1% and jobless claims trending lower. However, inflation clearly remains a thorn in the side of the outlook. Core consumer and producer price growth are both running at a pace above the Fed’s (and the bond market’s) comfort level. Odds are now well above 50% that a Fed hike will emerge in September.
AI Looking More Like a Boom than a Bubble
AI continues to be the driving force for stocks, but given its unusual economic and earnings contributions, the trade is so far looking more like a boom than a bubble that’s ready to pop. In our Market Sense on August 12th we discuss how AI-Capex is expected to account for 2.5% of GDP this year and could accelerate in coming years to surpass the 2.2% that railroads accounted for in the 1880s and the 1.1% during the fiber buildout. Likewise, while we note in our Market Sense on August 20th that past investment booms don’t follow a clean playbook, the AI cycle is unusual for how closely price is following corporate earnings. Just over 3 years into the build, earnings are up 33% compared to 10% for the telecom-fiber and 19% for the railroad era. That’s just a 20-point gap with price gains and well shy of the 92-point spread that opened up by this time in the late 1990s, confirming that valuation expansion has been comparatively muted in the AI boom cycle. Debt funding for the boom is accelerating, but leverage is still rather muted compared to past cycles (discussed in Market Sense here).
Stellar Earnings Season Powers Stocks to New Highs
US companies notched another extraordinarily strong earnings season with S&P 500 EPS rising 32.7% on a current constituent basis versus the preseason forecast for 23.2%. This is the strongest growth since 3Q21 and in the 94th percentile of history. As we noted in our Market Sense from August 28th, earnings gains are broadening – excluding the mag-7 companies the S&P 500 posted 32.4% growth. Thanks to the extremely strong earnings season, the S&P 500 touched a new high and ended August up 2.6% for the month and up 12.3% year to date. Small caps and emerging market equities continued to edge out US large caps (up 0.9% and 3.4%, respectively in August and 19.1% and 22.6%, respectively YTD).
New Leadership is the Story in Equities Even as Year’s Laggards Take August
Even after a mixed August, value continues to top growth in equity markets this year, the Mag-7 continues to underperform and small caps remain in the lead, all cued by earnings trends. Volatility remains the story for the mag-7 as the group contends with a combination of climbing capex and shrinking free cash flow. Demonstrated return on AI investment and strong forward guidance is increasingly required for these stocks to sustain gains. Meanwhile, other companies continue to benefit from the positive impact of the mag-7’s spending on the economy. On the small cap front, revenue growth is steadily catching up to large caps, rising 11.1% in 2Q – beating the 7.5% forecast and the strongest rate of expansion since 3Q22. Looking forward, given the sharp rise in energy and tech forecasts, earnings are likely to be particularly sensitive to oil prices and AI-capex plans. There’s been a sharp divergence between S&P’s growth style and Russell’s definition this year with the latter sharply underperforming both its large cap peers and value stocks. This is explained by index rules on what makes a value versus a growth stock (see our Market Sense on this here). Digging into the details, S&P 500 pure value is still leading pure growth, showing that there’s still a broad appetite for cheaper shares.
Little Movement on Iran Peace Leaves Oil Flat
West Texas Intermediate (WTI) crude was essentially flat for the month as tensions with Iran reignite while the country’s proposed deal with Oman to reopen a shipping route in the Strait of Hormuz keeps hopes for some relief alive. At $86/bbl, oil is still roughly 50% above the December low and in the 81st percentile of readings back to 1995. Crude is likely to remain heavily headline-driven and could continue to weigh on consumer-sector earnings forecasts while lifting energy EPS.
Bonds Whipsawed by Dovish Start, Hawkish End to August
Bond yields on the long end broke to new highs as Fed funds futures took a windy path to finish about where they started the month of August. September hike odds swung from ~65% to roughly 35% for the September FOMC meeting early in the month, only to close out the month back where they started. Yet, the long end climbed to a nearly 20-year high with the 30-year yield briefly clearing 5.3% midmonth (see our Market Sense on the state of 30-year Treasuries here). Treasury Secretary Bessent announced a doubling of long-end treasury buybacks as public debt crossed $40T, but relief was short lived as market participants focused on the term-premium and fiscal supply story, amplified by record AI-related issuance. At Jackson Hole, chair Warsh leaned hawkish, calling 2% a “firm, fixed target” for inflation and stating that financial conditions were not restrictive, but stopped short of providing any color on the reaction function. The belly of the curve remains the most appealing in this environment, where the short-end faces binary Fed-driven outcomes, and the long-end doesn’t provide adequate compensation for fiscal and supply risk.
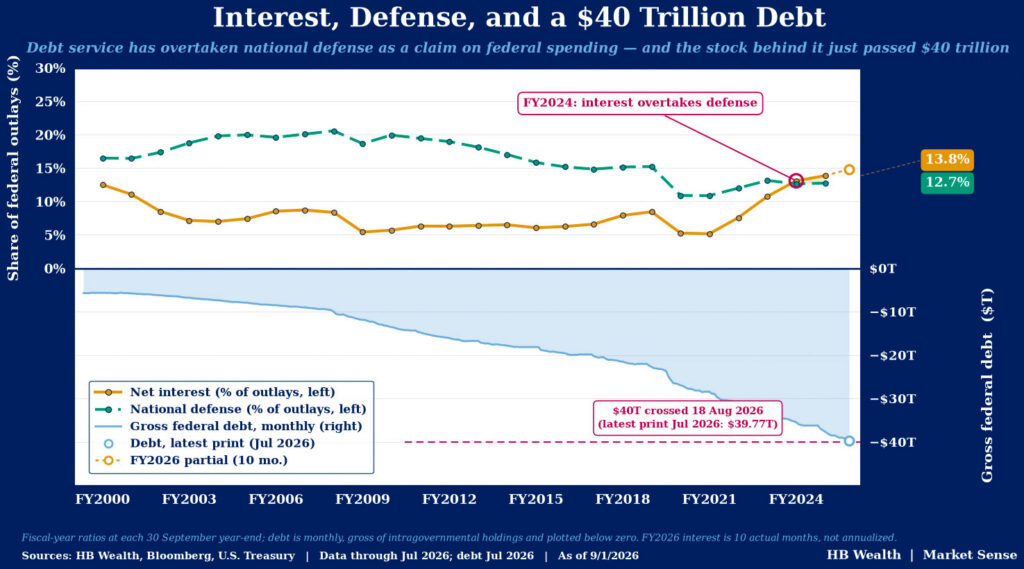
Chart of the Month
The increased refinancing of existing debt leads to more debt at higher interest rates, creating somewhat of a compounding effect that has pushed longer rates higher. Four years ago, net interest payments were near the bottom of primary spending categories of the federal government, according to the CBO. Last year, interest payments surpassed defense spending given the continued deficit and rising Treasury yields. By 2029, the CBO projects interest payments to also overtake Medicare, and the entire discretionary budget by 2038.
Disclosure: HB Wealth is an SEC-registered investment adviser. The information reflects the author’s views, opinions, and analyses as the publication date. The information is provided for informational purposes only and does not constitute an offer to sell or a solicitation of an offer to buy any investment product. This information contains forward-looking statements, predictions, and forecasts (“forward-looking statements”) concerning the belief and opinions in respect to the future. Forward-looking statements involve risks and uncertainties, and undue reliance should not be placed on them. There can be no assurance that forward-looking statements will prove to be accurate, and actual results and future events could differ materially from those anticipated in such statements. The information does not represent legal, tax, accounting, or investment advice; recipients should consult their respective advisors regarding such matters. Certain information herein is based on third-party sources believed to be reliable, but which have not been independently verified. Past performance is not a guarantee or indicator of future results; inherent in any investment is the risk of loss.