








Abstract:
- Growth versus value has become a hot topic in equity markets this year as conflicting signals have emerged among popular benchmarks. Russell 1000 growth is severely trailing its value counterpart while S&P 500 growth is beating its own value counterpart.
- This divergence isn’t really about growth; it’s about whether momentum sits inside the growth definition by the index provider. S&P counts momentum as a growth factor. Russell doesn’t.
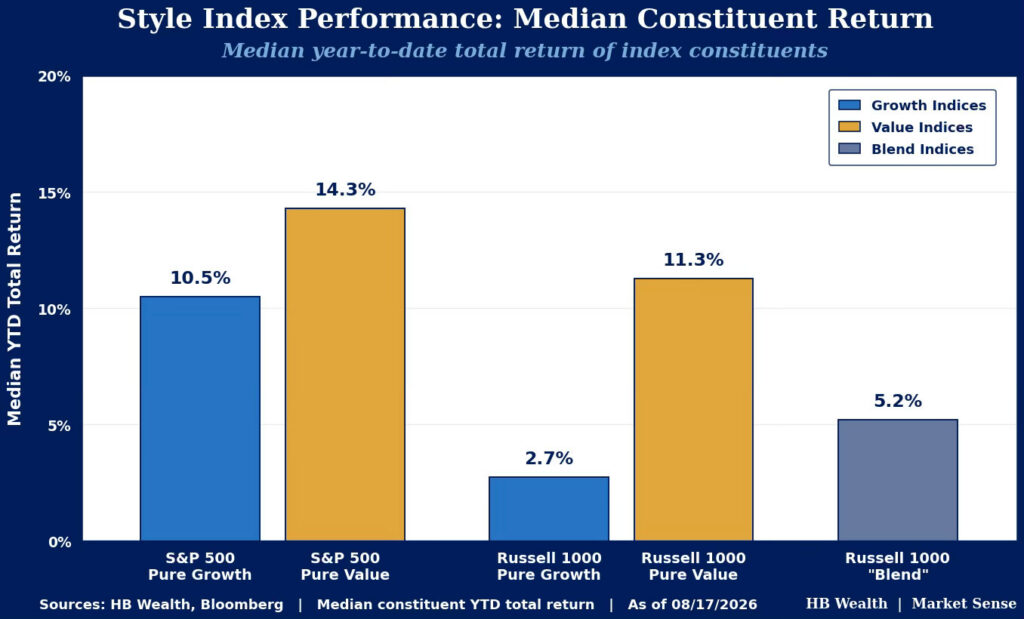
- On a median basis, value wins in both families, suggesting that the S&P growth outperformance is more due to weightings than it is any sort of signal about growth stocks at large. Cap-weighted, S&P Pure Growth leads at a +28.2% year-to-date return; on median it drops to +10.5%, behind Pure Value’s +14.3%.
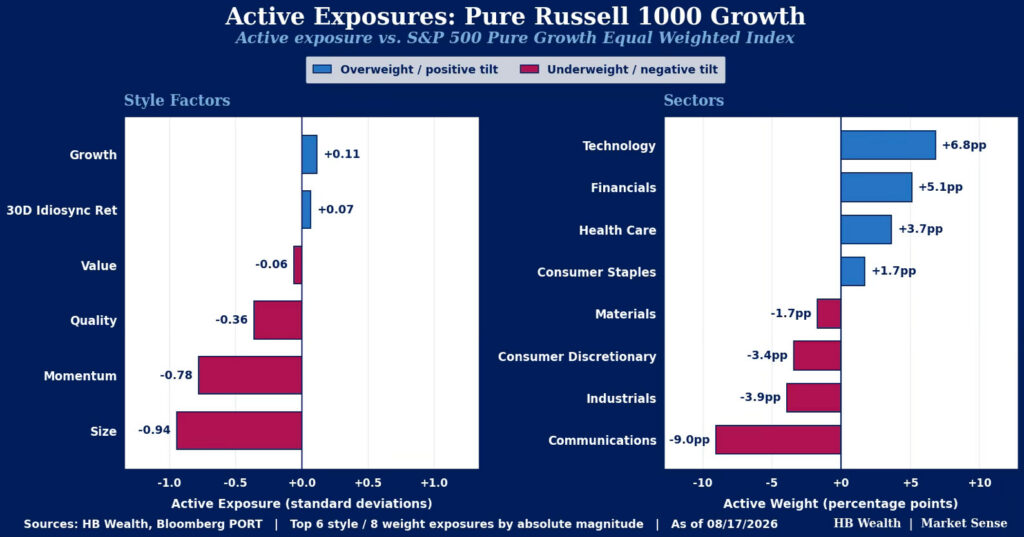
- Factor exposures corroborate the story. Pure Russell 1000 growth carries a −0.78 standard deviation active momentum tilt against S&P Pure Growth Equal Weighted, alongside −0.94 standard deviations on size, while its active growth loading is only +0.11 standard deviations.
Growth and value indices are sending a lot of mixed messages this year. Russell 1000 growth is underperforming its value counterpart by a wide margin, but also underperforming S&P 500 growth, which is in turn outperforming its value counterpart. This begs the question, is growth or value having a better year? The answer, somewhat bizarrely, is largely found by examining the momentum factor. High momentum stocks strongly outperformed in the first half of this year before taking a dive in July. Russell does not consider momentum to be a growth characteristic, but S&P does. As a result, momentum is making some growth indices look better than others.
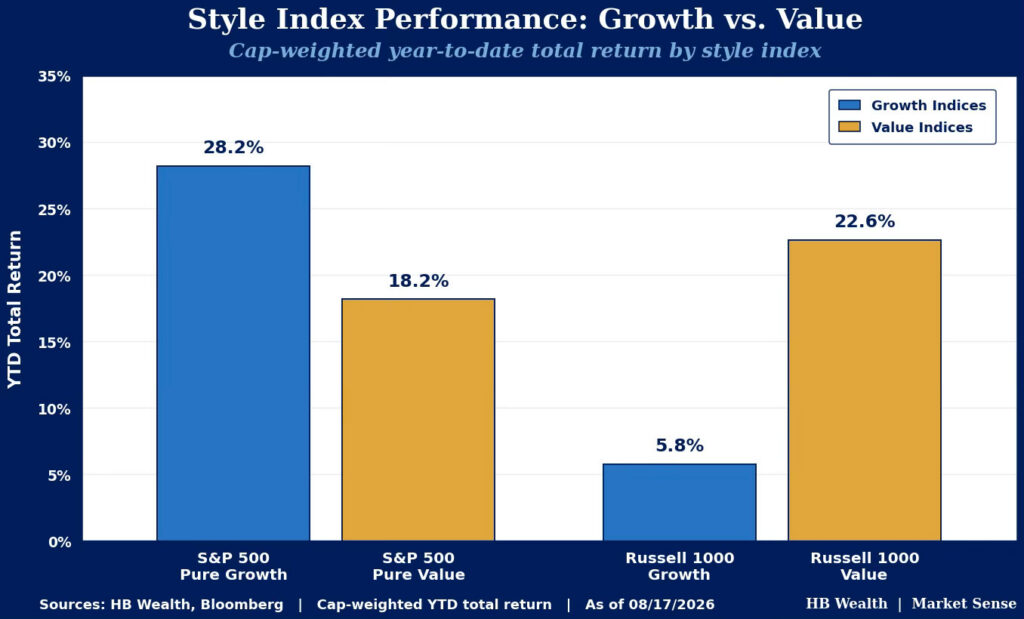
S&P Growth Index Outperformance Is Not About Growth. It is Due to Momentum
Russell 1000 growth has sharply lagged its value counterpart year to date. This is in part due to reconstitution timing – the June reshuffle coincidentally moved many high flying value stocks to growth just as they were topping – but it is mostly due to growth stocks falling out style this year. Russell growth lags both its value peer and S&P’s growth index on a median basis, even after adjusting for the reconstitution effect.
Style definitions are the driver of the difference between growth styles. S&P uses three factors to define the growth style – sales growth, the rate of EPS growth, and momentum – while Russell uses two — sales per share growth and a medium-term EPS growth forecast. In other words, Russell’s definitions are closer to what most investors would usually classify as “growth”, while S&P includes a momentum factor in its definition.
To do a clean comparison of growth, value and blend portfolios, we classify any overlap in the Russell 1000 styles as blend and remove them from the growth and value baskets to arrive at something more akin to “pure” style definitions. By that definition, Russell 1000 growth stocks have posted a median 2.7% gain this year. That compares to the 5.2% median return for stocks that qualify as blend and a 11.3% median return for value stocks. S&P’s growth index has also underperformed its value counterpart on median, consistent with the style spread evident in the Russell benchmarks.
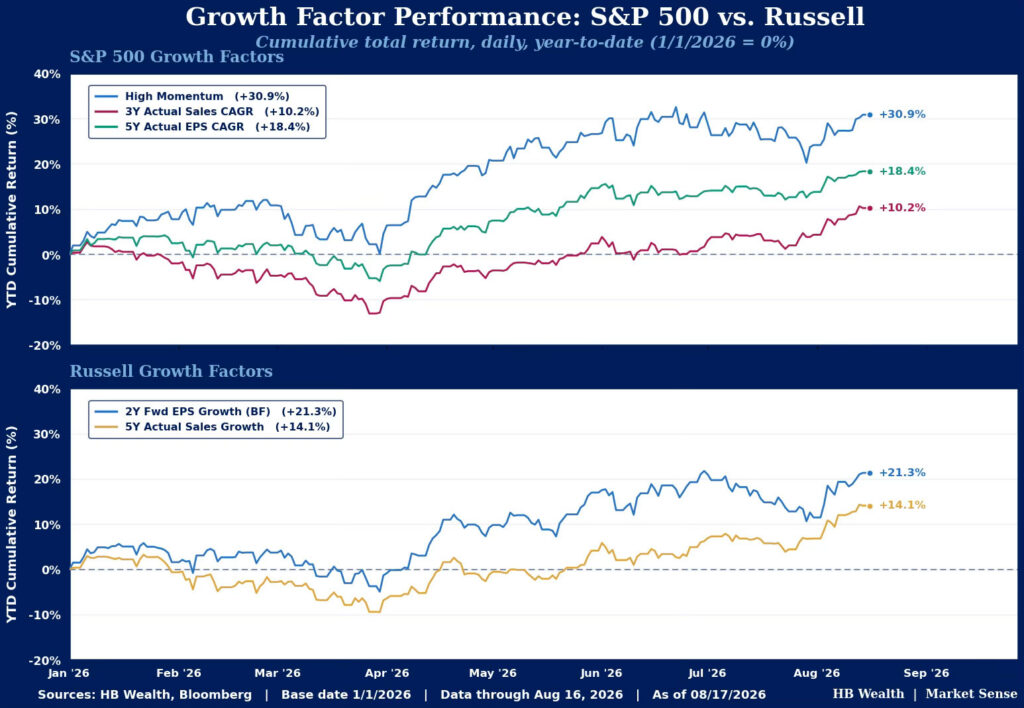
S&P 500 pure growth (which does not contain any overlap with pure value) is up a median 10.5% year to date. On an equal weighted basis, this index has strongly outperformed Russell 1000 growth (no reconstitution). In fact, of the nine GICS sectors in the Russell 1000 growth index, eight underperformed their S&P 500 pure growth peers on median, led by tech, industrials, real estate and communications. But a look at factors shows that a significant portion of the year-to-date outperformance for the S&P growth gauge boils down to momentum. Of the five growth factors utilized across the growth index providers, S&P 500 momentum (up 30.9%) is by far the best performing year-to-date. Recall that S&P’s definition embeds momentum as a factor for growth stock selection, whereas Russells’ uses only medium-term EPS growth (this factor is up 21.3% this year) and past 5-year sales growth (up 14.1%). The other two S&P factors – trailing three-year EPS growth (up 18.4%) and trailing three year sales growth (10.2%) – generally were in line with Russell corollaries within each respective universe.
S&P 500 pure growth (which does not contain any overlap with pure value) is up a median 10.5% year to date. On an equal weighted basis, this index has strongly outperformed Russell 1000 growth (no reconstitution). In fact, of the nine GICS sectors in the Russell 1000 growth index, eight underperformed their S&P 500 pure growth peers on median, led by tech, industrials, real estate and communications. But a look at factors shows that a significant portion of the year-to-date outperformance for the S&P growth gauge boils down to momentum. Of the five growth factors utilized across the growth index providers, S&P 500 momentum (up 30.9%) is by far the best performing year-to-date. Recall that S&P’s definition embeds momentum as a factor for growth stock selection, whereas Russells’ uses only medium-term EPS growth (this factor is up 21.3% this year) and past 5-year sales growth (up 14.1%). The other two S&P factors – trailing three-year EPS growth (up 18.4%) and trailing three year sales growth (10.2%) – generally were in line with Russell corollaries within each respective universe.
Disclosure: HB Wealth is an SECregistered investment adviser. The information reflects the author’s views, opinions, and analyses as the publication date. The information is provided for informational purposes only and does not constitute an offer to sell or a solicitation of an offer to buy any investment product. This information contains forward-looking statements, predictions, and forecasts (“forward-looking statements”) concerning the belief and opinions in respect to the future. Forward-looking statements involve risks and uncertainties, and undue reliance should not be placed on them. There can be no assurance that forward-looking statements will prove to be accurate, and actual results and future events could differ materially from those anticipated in such statements. The information does not represent legal, tax, accounting, or investment advice; recipients should consult their respective advisors regarding such matters. Certain information herein is based on third-party sources believed to be reliable, but which have not been independently verified. Past performance is not a guarantee or indicator of future results; inherent in any investment is the risk of loss.