








Abstract:
- Elevated capex has been spreading beyond the tech sector, helping stocks to another extraordinarily strong earnings season. S&P 500 EQ EPS rose 33.2% YoY, the strongest pace since 3Q21 and in the 94th percentile of historical experiences.
- Fundamental gains are broadening with the S&P 500 ex-mag-7 earnings rising more than 32.4%, driving broad-based gains. Small caps are likewise catching up to large cap topline growth.
- Lofty hyperscaler forecasts resulted in significant divergences in performance across the mag-7 this earnings season.
- Earnings breadth was particularly strong but is nearing levels where it typically tops out. Margin forecasts likewise have risen the most on record over the past nine months than any other stretch beside the recovery from 2009. We’re watching both signals for a turn that could disrupt the rally.
- Large cap estimates are on the rise, fueling the advance but rising the risk of volatility around results as we saw this season with many high-profile tech stocks.
- Oil prices and AI capex continue to pose risks to the forward outlook. Consensus is positioned for both to continue recent trends.
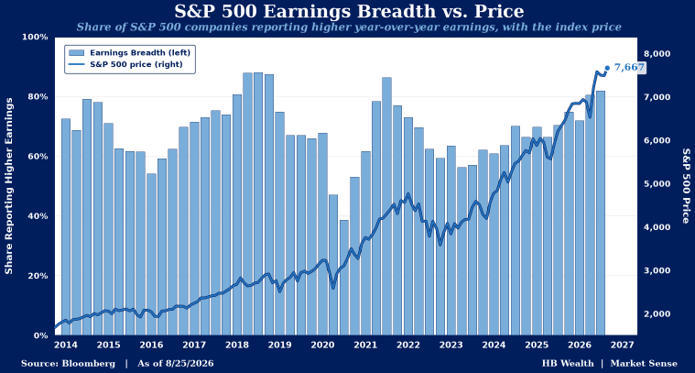
The AI-powered earnings advance is the gift that keeps on giving to stocks, as the benefits of elevated capital spending have started to spread beyond the tech sector to impact a broad swath of US companies. Every S&P 500 sector but health care, which faced several large accounting charge-offs that impacted earnings, contributed to the index’s 33.2% EPS growth (versus the expected 23.2%). More than 86% of large cap stocks likewise beat their consensus hurdles, the highest mark since 2Q21, and 82.2% of stocks showed year-over-year earnings growth – the second consecutive quarter over 80% and approaching the 88% post-Great Financial Crisis (GFC) high from 2018. Small caps also participated, easily clearing their preseason revenue bar and posting the strongest growth since mid-2022.
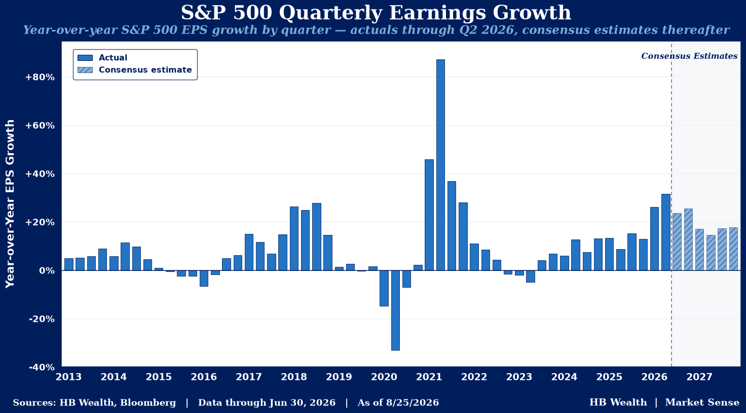
Earnings gains were largely powered by a strong revenue advance, though expanding margins certainly helped. S&P 500 topline grew 15.6% versus the 12.1% forecast – the highest quarterly mark for the index since 4Q21. Likewise, net margins hit 15.6% — just 4 bps off the index’s high watermark from last quarter — clearing the 14.9% estimate at the start of the season.
Despite strong results powering both large and small caps to all-time highs, tech and related stocks had to deal with significant volatility around individual results. Magnificent-7 hyperscalers received a fair amount of skepticism around capex plans and return on investment around AI-focused projects with those that demonstrated continued free cash flow generation or cloud growth generally spared from post-earnings onslaughts. Likewise, some chipmakers slid for the simple fact of not hitting the street’s most aggressive forecasts – a reflection of the extreme optimism that was baked into share prices. Nonetheless, these bumps did little to mar what was an exceptional earnings season.
No More Gap to Mind: The 493’s Resurgence is Here
Magnificent-7 earnings growth is still surging, but the gap between the mega-cap cohort and the rest of the S&P 500 (the 493) is at its narrowest point since 1Q23. In 2Q, the mag-7 posted 40.7% growth – a deceleration from last quarter’s 58.8% — while the 493’s earnings grew 32.4% (up from 17.5% in 1Q). That’s the best mark for the latter group since we started splitting the index this way at the end of 2021, surpassing the 28.8% high watermark from 1Q22. In fact, consensus now forecasts earnings for the 493 to surpass that for the mag-7 by an average 1,128 bps from 3Q26-1Q27 before ceding the lead yet again – giving the rest of the index plenty of leeway to continue their lead.
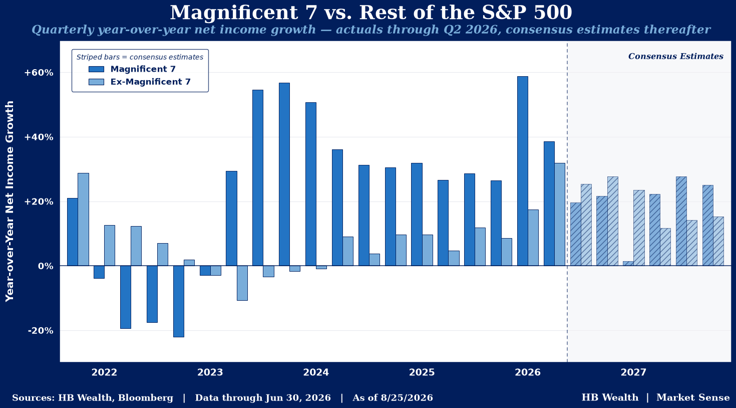
The broad-based earnings surge is likewise driving performance improvement outside the magnificent-7, as investors rotate toward new opportunities and AI-focused magnificent-7 stocks contend with extreme price reactions to continued capex and shrinking free cash flow. Since October, the magnificent-7 has gained just 1.8% while the index at large is up 12% as consensus forecasts for a narrowing earnings gap have largely proven correct minus 1Q’s blowout quarter for the mag-7. Performance over that recent stretch harkens back to the 2022 bear market – the last time that 493 earnings outstripped the mag-7’s. During that period, rapidly rising rates, a post-pandemic slowdown in advertising and a slowdown in Apple’s China business turned mag-7 earnings negative. However, the rest of the index held up, posting earnings growth until 1Q23 (when the mag-7 likewise caught up) – leading to more than 31 percentage points of outperformance for the index at large.
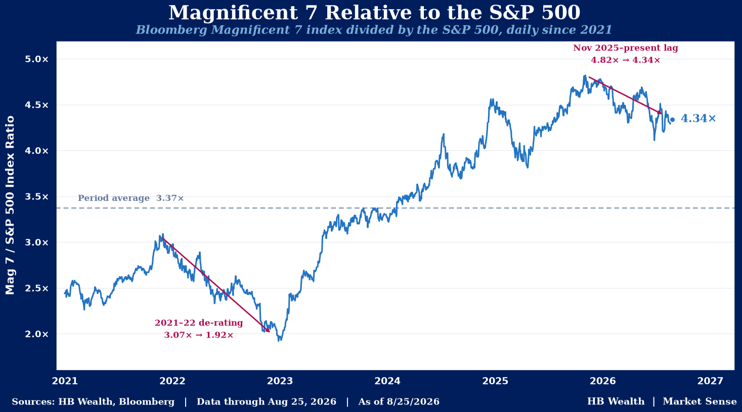
While they’re not exact corollaries, the 2022 period and today demonstrate that relative fundamental trends matter to the mega-cap cohort’s performance. However, the recent magnificent-7 experience is less about growth tumbling and more about investor skittishness around the sustainability of AI as a theme and the return on investment these companies might reap – and that was especially evident this earnings season. Of the magnificent-7, just three – Microsoft, Amazon and Nvidia– rose immediately following earnings. Microsoft was able to maintain positive cash flow and pointed to strong cloud demand and AI-user growth as justification for its spending while Amazon offset higher capex forecasts with the best AWS-segment growth since 2021. Ahead of earnings, OpenAI suggested their “Jalapeno” chips are proving more capable for larger models than their competition from Nvidia but the stock was unfazed. However, following its report the immediate reaction was negative despite a resounding top and bottom line beat (and strong guidance) as Nvidia now expects slight margin compression amid rising component costs. That initial negativity was offset by the management call where they forecasted a whopping 70% revenue gain in FY28, turning the stock sharply positive in the day after reporting.
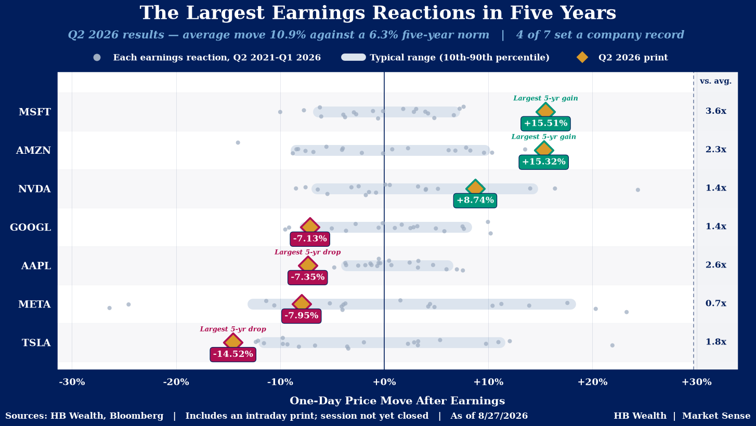
Conversely, Tesla was the worst performing of the cohort following its earnings (falling nearly 15%), missing the hurdle. The company reported negative free cash flow amid surging spending. Communications sector giants Meta and Alphabet reported somewhat divergent results that ended with similar following day underperformance. Meta missed the consensus bar, raising the low end of capex guidance and showing sharply decelerating cash flow. Alphabet, however, flew past its hurdle amid a surge in cloud earnings but slipped as cash flow turned negative (for the first time in the company’s public history). Apple – more of a hardware play given lack of presence in cloud computing – likewise fell after reporting, however, due to slower guidance due to memory supply constraints.
Monitoring Signals for a Top: Can Earnings Breadth and Margins Keep Climbing?
The extremely strong state of earnings leaves only one issue to worry about for stocks, and that is – it may not get much better than this. Two signals to monitor on this front are earnings breadth and margins. Both will need to continue to power higher to signal a likely continuation of the bull market in equities.
Peaks and troughs in earnings breadth have been especially meaningful to stocks’ direction over the past decade. Breadth hit an all-time high in 2Q18 (at 88%) and began to fade over the subsequent quarters, contributing to the 19.8% peak to trough correction in the S&P 500 that spanned September-December of that year. Likewise, breadth hit another high in 2Q21 (at 86.4%) and when the cooling trend was confirmed two quarters later, stocks began their descent into the 2022 bear market. Similarly, bottoming breadth and 2020 and 2022-2023 helped confirm ongoing recoveries off major bear market lows.
While breadth is nearing levels where it’s typically topped out and led to periods of indigestion for stocks, consensus implies that peak could still be at least a few quarters away. In 2Q, every S&P 500 sector posted earnings growth except for health care – led by energy, tech and materials. However, consensus estimates see every group growing in 3Q and that trend could carry through the end of the year before communications and discretionary hit a difficult, comparison-fueled rough patch in 1Q27 (recall the enormous hyperscaler growth in 1Q26 of which Alphabet and Meta dominate communications while Amazon and Tesla headline discretionary). Likewise, earnings breadth – the percentage of companies posting earnings growth year-over-year – surged to 82.2% in 2Q from 80.6% in 1Q.
Margin trends are similarly a strong indicator of impending market tops and the consensus outlook is showing little sign of slowing down. Ahead of the S&P 500’s declines in 2011, 2015, 2018 and 2020, reduced projections ultimately weighed on prices. However, estimates just keep climbing – at the start of 2026 consensus pegged the S&P 500 for 18.8% forward 12-month operating margins, but that has climbed to 21.2% currently. That surge is the strongest similar length rise on record outside of the immediate recovery from the Great Financial Crisis. On a sector basis, every group is participating in the rise in operating margin forecasts with energy, tech, materials, utilities, and communications leading on average and only discretionary and staples margins set to expand less than 100 bps versus the prior four quarter norm.
This Time is Truly Different: Small Caps are Linking Up with Large’s Growth
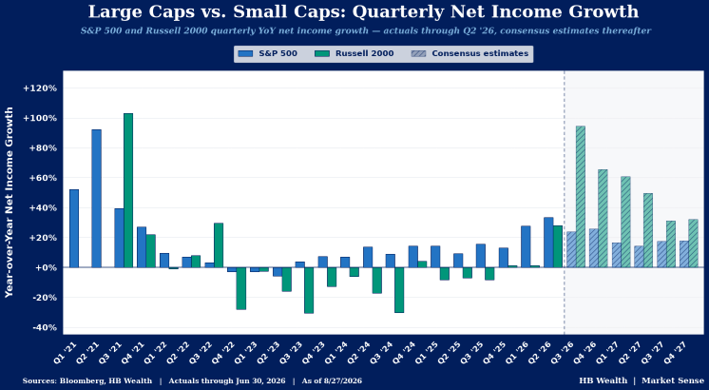
There’s been a common drumbeat from consensus that small cap revenues would surge and begin to link up to that observed across large caps. But each time, the sellside proved a bit too optimistic as a narrow cohort of large cap stocks drove the overall earnings advance. However, 2026 has thus far been different – small cap revenue growth is surging and approaching that of its larger peers which is in turn driving an extraordinary net income comeback and powering the Russell 2000 to new highs.
In 2Q, consensus forecasted Russell 2000 revenues to rise 7.5%. Instead, they’re on track for 11.1% on a current constituent basis with roughly 6% of index market cap left to report. While that’s short of the S&P 500’s 15.6% rise, it’s the best mark for the small cap gauge since 3Q22. Still, forecasts are hardly moving at the aggregate level, down an average 53 bps over the next four quarters – injecting little optimism into the sales stream and giving the gauge plenty of leeway to beat.
Russell 2000 net margins look to finally be back on the rise, driving an extraordinary earnings advance that’s likewise supporting small caps. In 2Q, net margins rose to 3.9% from the 3% low in 1Q and consensus sees profitability steadily rising through 2027. The margin rise along with the strong sales beat pushed earnings 28.1% higher in 2Q and consensus expects small caps to lead large caps over the next four quarters by nearly 50 percentage points on average.
The Cost of Success: Beat and Raise Trend Heightens Stakes for Coming Seasons
Large cap earnings estimates continue to rise as beats pour in. While that’s helped fuel the climb to new highs, as we’ve observed with the hyperscalers and select chipmakers this season it also raises the stakes and adds to volatility around individual results. Since the start of the 2Q season, S&P 500 EPS forecasts are up for each of the next three quarters (and north of 20% for 3Q and 4Q26) with the typical cut to 2Q27 estimates to reflect the more difficult comparisons following this quarter’s beat. On average, energy, tech and industrials 2H estimates have been raised the most while materials (from an extraordinarily high base) and staples have been cut the most. Revision momentum – the number of hikes to the next 12-month EPS forecast over the past month minus the number of cuts over the total count of companies with estimates — is likewise still positive for the index, reflecting a solid breadth of hikes.
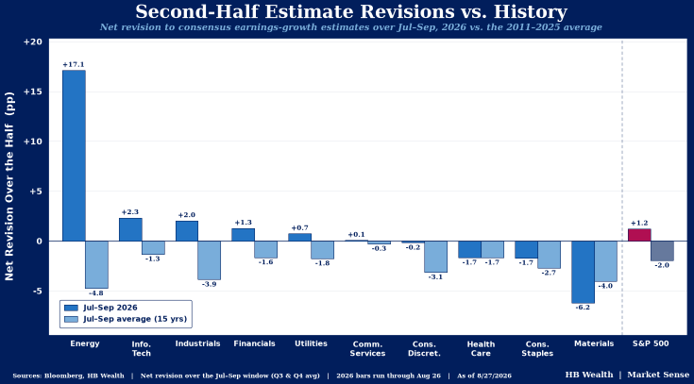
The pattern of hikes reveal the primary risks to the forward outlook as centered on two factors – oil prices and AI capex. First, rising energy prices as a result of the war in Iran have supported domestic oil producers and infused the group with consensus optimism. While a resolution of the war remains elusive, a return to pre-conflict oil prices risks consensus getting over their skis on large cap energy. That same risk cuts to possible upside for consumer-related sectors which have been squeezed by inflation and an uneasy US consumer, however, and higher for longer oil prices could likewise act as a headwind to some industrials. Second, a peak in capex – possibly due to anemic return on investment for the hyperscalers – could pose a risk to lofty tech forecasts. While that is not the base case at the moment – consensus sees capex continuing to surge through at least 2027 — it is worth monitoring especially as most mega-cap hyperscalers continue to hit volatility around earnings.
Disclosure: HB Wealth is an SECregistered investment adviser. The information reflects the author’s views, opinions, and analyses as the publication date. The information is provided for informational purposes only and does not constitute an offer to sell or a solicitation of an offer to buy any investment product. This information contains forward-looking statements, predictions, and forecasts (“forward-looking statements”) concerning the belief and opinions in respect to the future. Forward-looking statements involve risks and uncertainties, and undue reliance should not be placed on them. There can be no assurance that forward-looking statements will prove to be accurate, and actual results and future events could differ materially from those anticipated in such statements. The information does not represent legal, tax, accounting, or investment advice; recipients should consult their respective advisors regarding such matters. Certain information herein is based on third-party sources believed to be reliable, but which have not been independently verified. Past performance is not a guarantee or indicator of future results; inherent in any investment is the risk of loss.