








Abstract:
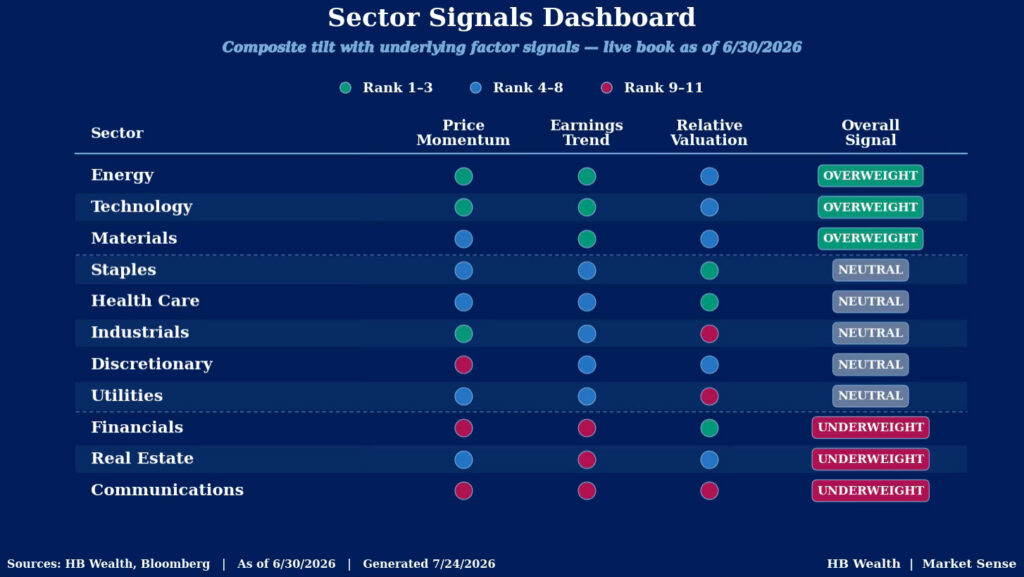
- The HB Wealth Market Sense research team’s sector model currently favors large-cap energy, tech and materials while it disfavors communications, real estate and financials.
- Earnings trends were the most consistent component factor in our model. Commodity sensitive overweights are benefitting from higher prices while tech still contains most early-AI winners. Conversely, rate sensitive earnings forecasts are a risk with rate hikes on the table while communications’ hyperscalers and media segments don’t have the appeal of tech.
- Our model is factor based with three component factors – price momentum, earnings trends and relative valuations. See the final section of the report for the full methodology.
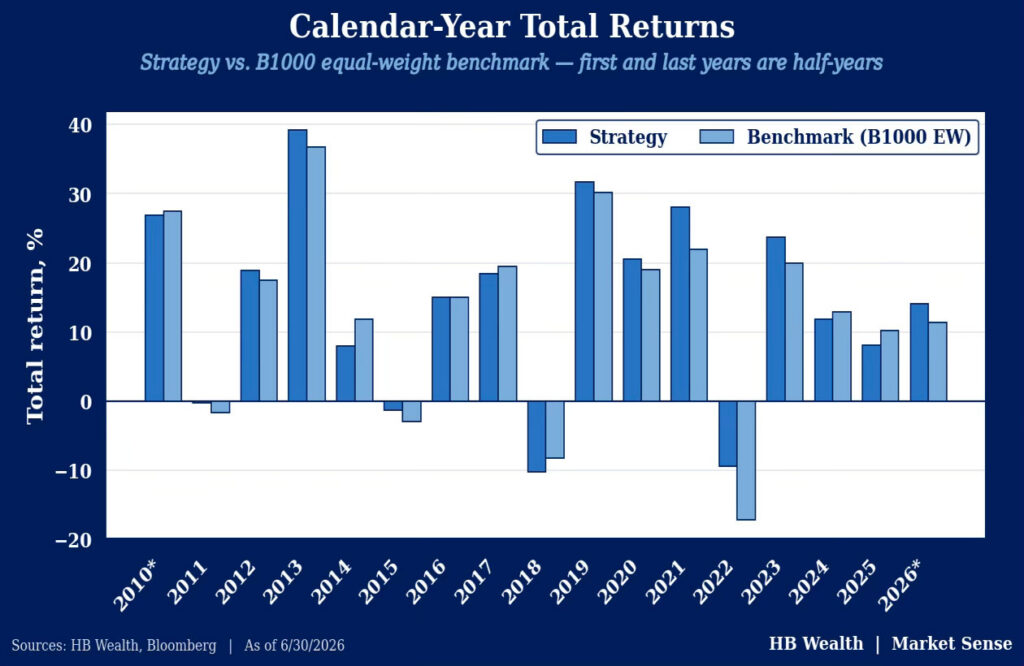
- This strategy was backtested to 2010, generating 115-bps of sector allocation alpha and outperformed in 67% of years.
It’s too early to give up on year-to-date sector winners in large caps, according to our sector model, which suggests an overweight position in energy, tech and materials – some of the year’s biggest outperformers. Cyclical sectors at the forefront of our model (energy and materials) have fundamentally benefitted from higher commodity prices and consensus expects those tailwinds to persist for some time. Meanwhile, we suggest steering relatively clear of weaker and interest rate sensitive groups like real estate and financials despite strong earnings for the latter emerging this season as prospects of a rate hike possibly later this year and difficult year over year comparisons weigh on estimates. Communications rounds out our suggested underweights as early AI winners remain concentrated in tech’s semiconductor industry and not communications’ hyperscaler heavyweights (Alphabet and Meta). Meanwhile the sector’s media group continues to fundamentally struggle despite ongoing consolidation.
Accelerating earnings are the driving force behind our constructive view and though tech’s EPS surge is well documented, investors have been quick to write off energy and materials’ rise as a temporary consequence of conflict in the middle east. However, those groups had largely been in an earnings recession since mid-2022 and gains track with improving global economic conditions. While none of our overweights are cheap, multiples are not far from norms and each generally enjoys decent to strong price momentum. Our model runs off the Bloomberg 1000 equal weighted index and rebalances semiannually, using three component factors (price momentum, earnings trends and relative valuations) to isolate sectors it thinks should be overweight, market weight and underweight.
Earnings Could Carry Cyclicals to Glory in 2H
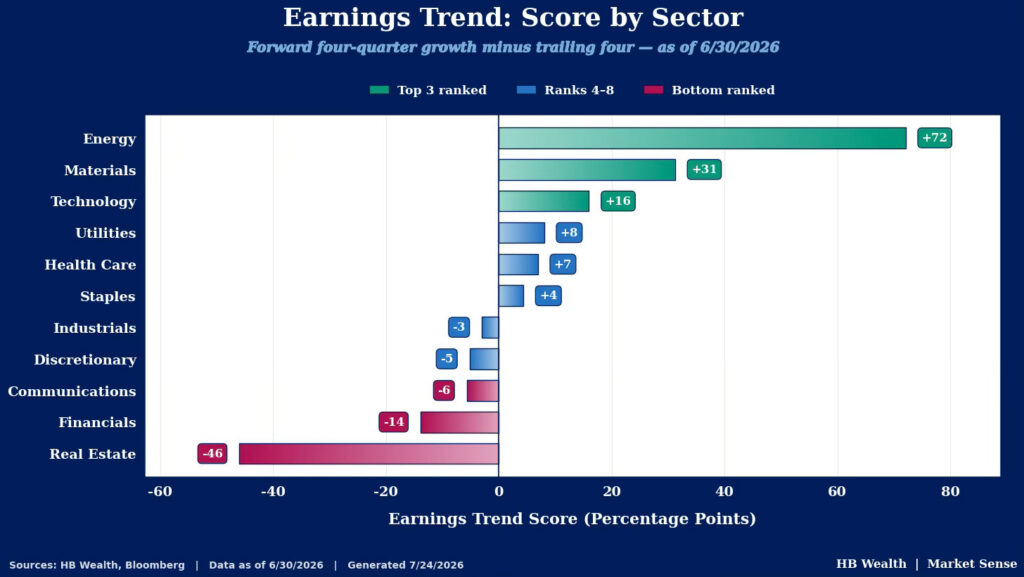
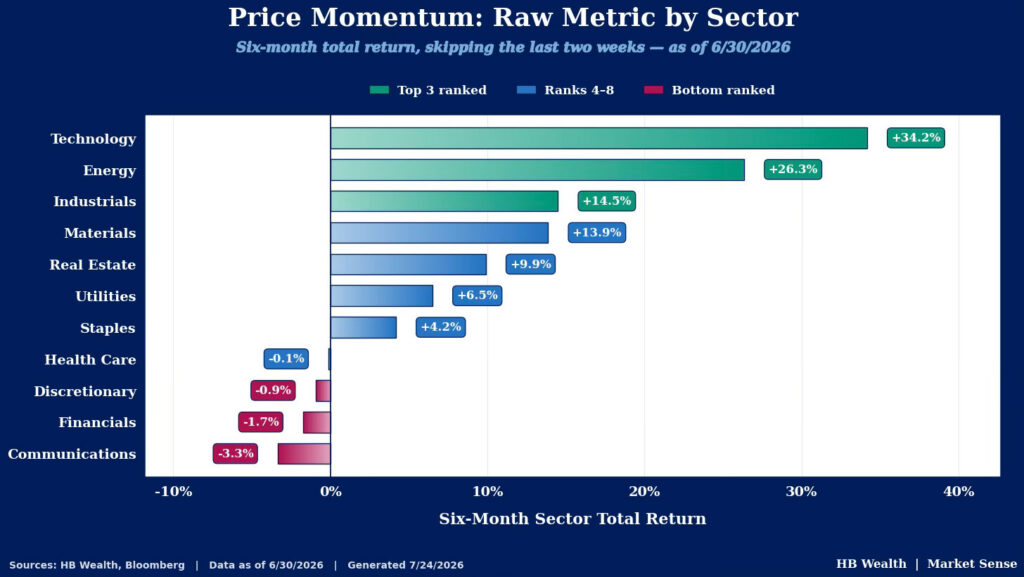
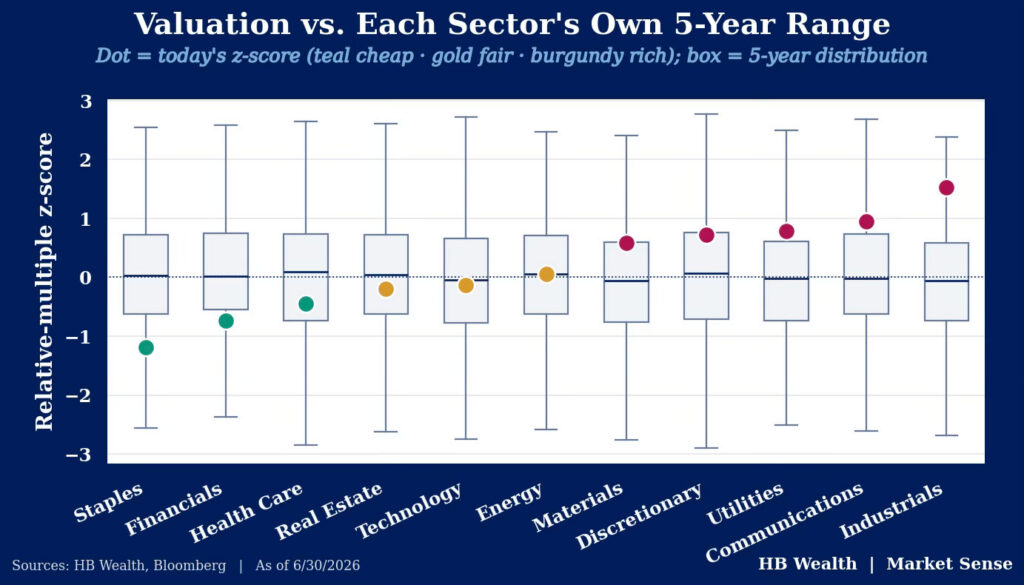
Energy, materials and tech top our sector rankings thanks to favorable earnings scores with the former two groups enjoying ongoing tailwinds from higher commodity prices while pulling out of a multi-year EPS recession and tech’s early AI winners are expected to continue to reap the benefits of hyperscaler capex. Likewise, our read on price momentum – equal weighted sector six-month minus two-week price performance – supports energy and tech while materials scores in the middle of the pack. Though none of the overweight sectors have particularly compelling relative valuations – the 5-year z-score of each sector’s relative “preferred” valuation metric to the universe – multiples shouldn’t stand in the way of a continued rally with each sector in the top bin carrying valuations within one standard deviation from the norm. However, earnings trends – the difference between the average of each sector’s next four quarter EPS growth forecast and the average of the actual past four quarter growth – supports all three overweight sectors while likewise shunning the three suggested underweights.
Earnings trends for energy and materials had begun to turn even before the war with Iran drove a surge in commodity prices. From 3Q22-2Q25, materials sector earnings had contracted in 11 of 12 quarters with weakness in the chemicals industry coinciding with a weak stretch for the US’ industrial economy. Likewise, energy began an earnings downturn in 2Q23, following a surge as oil prices rose during the initial phases of the Ukraine war, that lasted until 4Q25. Tech, on the other hand, had already been firmly in earnings expansion and continued spending and enthusiasm around AI have only pushed estimates higher, resulting in earnings acceleration. Conversely, the underweight groups – communications, real estate and financials – all score poorly on the metric.
Price trends also support 2026’s winners, as even on an equal weighted basis these three sectors have a momentum tailwind to carry them forward. Currently, Information Technology ranks the strongest on the metric with a whopping 34.2% six-month gain excluding the past two weeks on average across its constituents. Energy is the next strongest, followed by Industrials. Conversely, discretionary, financials and communications have the weakest price momentum. Notably, poor consumer sentiment and high prices have weighed on discretionary stocks this year and without Amazon’s typical heavy weighting (in the cap weighted index), price momentum has suffered – recall that the metric is based off equally weighted performance. Financials’ performance has strengthened a bit since May but that hasn’t done much to improve its position given the private credit fears and rate hike scares that drove it to underperform earlier this year. Similarly, the bulk of communication-sector stocks lack the AI appeal of Alphabet and Meta which dominate the cap-weighted version of the sector – even though the two hyperscalers’ shine has begun to wear off given the excessive capex fears spooking investors presently.
On an equal weighted Price/EBITDA basis, Industrials is the most expensive sector, trading 1.5 standard deviations above its 5-year relative norm. It’s followed by communications and Utilities on a Price/EBITDA and Price/Earnings basis, respectively. Conversely, Consumer Staples (on Price/Sales), Financials (on Price/Book) and Health Care (on Price/Sales) are the cheapest of the 11 GICS sectors. Relative valuations are the most agnostic of the three factors that comprise our scorecard with each of the overweight sectors scoring in the middle.
Scorecard Construction – Isolating Alpha From Sector Allocation
Our sector model uses the Bloomberg 1000 equal weighted index as its universe and attempts to identify sectors that should be overweight, market weight and underweight in an equity portfolio. To arrive at its conclusion, we use three factors – price momentum, earnings trend and relative valuations – bucketed into the top three and bottom three sectors by each metric with the rest receiving a neutral rank to make sure that no individual factor outlier drives the overall ranking. These buckets are then averaged (equally weighted) across the three component factors and re-bucketed into the same top three/bottom three framework to arrive at the overweight, market weight and underweight suggestions. In the backtest, overweight groups are given a 750-bps allowance each that is funded by underweighting the bottom three groups by the same (if there’s not enough weight in an underweight group, we hold 0% and distribute its entire weighting) while holding the market weight basket the same as their share of the universe. To make sure we aren’t inadvertently picking stocks, overweights and underweights are distributed/taken equally from each of the sector’s constituents.
Our backtest back to 2010 found that our factor signals persisted for two quarters, leading us to adopt a semiannual rebalance frequency which has an added advantage of lower overall turnover. On this basis, our model generated 115 bps of annualized alpha versus the universe with 84% downside and 104% upside capture – highlighting the model’s ability to limit drawdowns. The scorecard outperformed in an impressive 67% of years across the backtested sample.
Disclosure: HB Wealth is an SECregistered investment adviser. The information reflects the author’s views, opinions, and analyses as the publication date. The information is provided for informational purposes only and does not constitute an offer to sell or a solicitation of an offer to buy any investment product. This information contains forward-looking statements, predictions, and forecasts (“forward-looking statements”) concerning the belief and opinions in respect to the future. Forward-looking statements involve risks and uncertainties, and undue reliance should not be placed on them. There can be no assurance that forward-looking statements will prove to be accurate, and actual results and future events could differ materially from those anticipated in such statements. The information does not represent legal, tax, accounting, or investment advice; recipients should consult their respective advisors regarding such matters. Certain information herein is based on third-party sources believed to be reliable, but which have not been independently verified. Past performance is not a guarantee or indicator of future results; inherent in any investment is the risk of loss.