








Abstract:
- Small caps could face some volatility should the Fed begin a rate hike cycle, though the extent will be driven by how much the 10-year moves and if earnings and the economy continue their current trajectory. If those hold firm, small caps could face minimal disruption.
- Rate hikes typically hit small caps via higher funding costs (WACC) given sub-investment grade debt. We’re watching High Yield spreads and looking for sharp spikes in 10-year yields as signposts for concern.
- Across capitalizations, the value factor has held up the best in the year after the first hike of the cycle though it faced significant volatility in 2022 as earnings and the economy began to sink.
- Energy has likewise outperformed in each of the past three hiking cycles while real estate, health care and communications struggled.
Small cap stocks have fared well year to date, powered higher by a resurgence in revenue growth as the AI-infrastructure build has fueled a pickup in economic activity. But as the 10-year has climbed toward 5% recently, the Russell 2000 has lost momentum – bringing into question the size’s ability to withstand a rate hike cycle. In fact, small cap companies typically have higher cost of capital than large cap peers as they’re often forced to tap into high yield rather than investment grade markets for debt funding, making them somewhat susceptible to higher rates. However, their ability to weather a possible hike cycle this time likely relies on the economy and earnings continuing to grind higher – a reality made evident by small cap stocks’ struggles in 2022-23 when hikes coincided with a flailing economy and an earnings recession that the Russell 2000 only just began pulling out of – as well as whether hikes drive 10-year yields higher. Consensus’ faith in earnings recovery remains unwavering, suggesting small caps should roll with the punches from rates, but we’re monitoring for signs of deterioration as well as keeping a close eye on the 10-year which could raise valuation concerns should it keep powering meaningfully higher.
Likewise, more expensive sectors could face the most volatility during a hike cycle. Since multiples have a rate component embedded by way of traditional discounted cash flow modeling, more expensive stocks are often repriced as rates rise – though over recent cycles, the relationship isn’t exactly clear. However, that relies on 10-year yields moving in step with the short end of the curve that’s more influenced by Fed policy. Hikes that cause the 10-year to drop – due to falling economic growth forecasts for instance – could produce drastically different outcomes than a full curve shift higher or steepening. Likewise rate sensitive sectors – real estate and utilities – could become less attractive as yields rise as investors switch to higher risk-free rates rather than similar dividend yielding stocks but might likewise get an offset via their defensive leanings should the market slip.
Higher WACC Could Cause Small Caps to Slack if Rates Meaningfully Rise
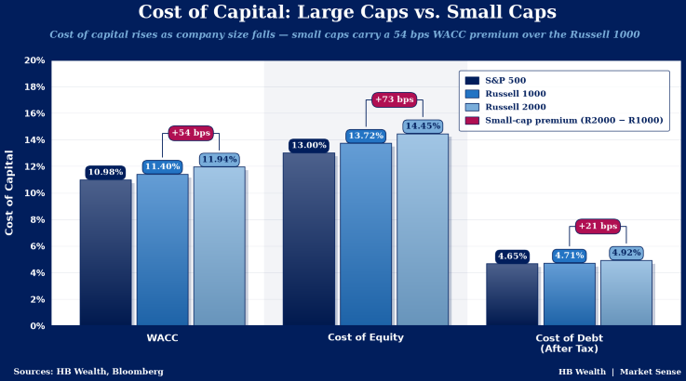
Small cap companies have a higher weighted average cost of capital (WACC) – the return companies would have to get on new projects to make it worthwhile, often used as the discount rate in valuation models – than larger peers. Based on data from Bloomberg, the median Russell 2000 company carries a WACC 54 bps above larger peers with the weighted average cost of equity 73 bps above and weighted average cost of debt (after tax) 21 bps higher. Though cost of equity is substantially higher, that value is approximated using the capital asset pricing model (CAPM) which incorporates a historical view of beta that changes with market conditions. On the other hand, the cost of debt is calculated using the rates from debt that’s issued, making it a more accurate measure.
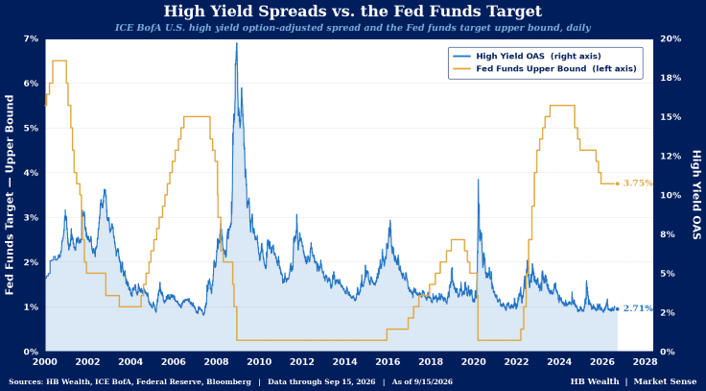
Nonetheless, more expensive debt funding for small caps is a function of reliance on high yield markets. While option adjusted spreads (OAS) remain tight at 271 bps, they’ve climbed steadily since August as rate hike forecasts have risen and are well above the Bloomberg US Agg Corporate’s (investment grade) spreads. Even during intra cycle hikes, like 2015 and 2022 high yield spreads rose significantly as both equity and bond markets struggled to digest the regime shift, leading to significant volatility for small caps.
A Single Hike Alone Won’t Derail Small Caps, 10-Year Yields More Important
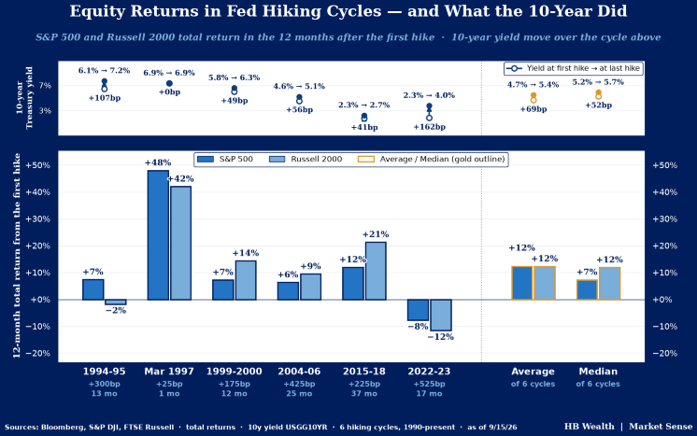
Historically, small caps have handled rate hike cycles somewhat well, though with a few drawdowns that appear to correlate to moves in the 10-year yield. Over the past 6 rate hike cycles going back to the early 1990s, small caps have on average run in lockstep with the S&P 500. However, that masks some outliers. The Russell 2000 fell over the course of the rate hike cycles that started in 1994 (down 2%) and 2022 (down 12%) which were two of the bigger hikes on record with the 10-year rising 107 bps and 162 bps, respectively. While the 2004-2006 period saw the Fed Funds rate rise 425 bps, 10-year yields only rose 56 bps and small caps were able to lead. Likewise, the 2015-18 hike cycle pushed the Fed Funds rate up 225 bps but the 10-year only rose 41 bps, allowing small caps to gain 21% to the S&P 500’s, 12%. Thus, small cap performance could come down to how future hikes are digested by the bond market and earnings and the economy’s ability to withstand the higher rates.
Value Factor Outperforms in Year Following First Hike
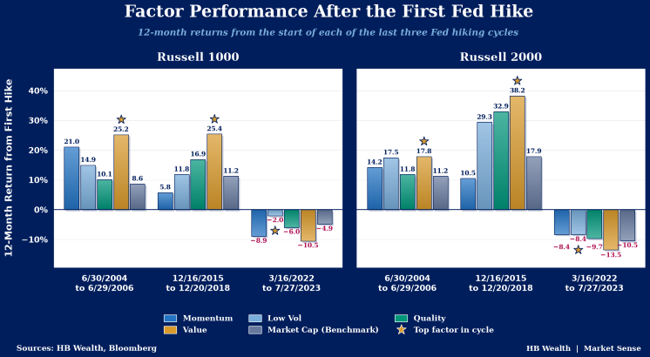
Over the past three rate hike cycles, the value factor has the most consistent record of outperforming across capitalizations – though cheaper stocks notably struggled in the 2022 cycle with the rapidly rising 10-year in that event the differentiator. In both the Russell 1000 and 2000 the value factor (cheaper stocks) was the best performing factor in the year following the hiking cycles that started in 2004 and 2015. However, across both large and small caps, the factor notably struggled following the 2022 hike cycle, dropping 10.5% and 13.5%, respectively, though all peers likewise slipped. That cycle, however, coincided with a broad market earnings recession and sluggish economy, putting the onus on both those to hold up and support stocks. Overall, besides value, low volatility, quality and momentum were generally the next best performers.
Real Estate, Health Care, Communications at Risk If History Rhymes
Across both large and small caps, some overlaps in sector performance in the first year of a rate hike cycle emerge. In large caps, real estate, health care, communications and discretionary were the worst performing groups on median across the past three cycles. Likewise, across small caps, communications, real estate and health care lagged. Conversely, energy was the best performing sector across capitalizations – posting either the best or second-best performance across all three cycles in both gauges. Industrials and utilities also tended to fare well in both size classes.
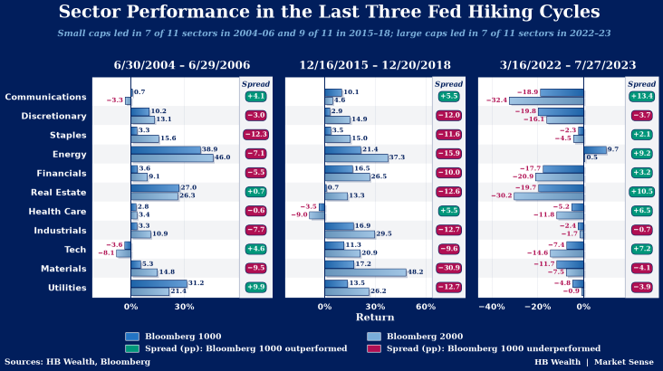
Valuations leading into the rate hike appeared to have some, loose relationship with performance. Health care’s struggles, particularly in small caps coincided with the group carrying the highest multiples relative to past 5-year history versus the other 10 GICS sectors ahead of the 2015 hike. Likewise, small cap communications posted the worst performance in the year following the 2022 hike and was also the most expensive leading into the rate move.
Disclosure: HB Wealth is an SECregistered investment adviser. The information reflects the author’s views, opinions, and analyses as the publication date. The information is provided for informational purposes only and does not constitute an offer to sell or a solicitation of an offer to buy any investment product. This information contains forward-looking statements, predictions, and forecasts (“forward-looking statements”) concerning the belief and opinions in respect to the future. Forward-looking statements involve risks and uncertainties, and undue reliance should not be placed on them. There can be no assurance that forward-looking statements will prove to be accurate, and actual results and future events could differ materially from those anticipated in such statements. The information does not represent legal, tax, accounting, or investment advice; recipients should consult their respective advisors regarding such matters. Certain information herein is based on third-party sources believed to be reliable, but which have not been independently verified. Past performance is not a guarantee or indicator of future results; inherent in any investment is the risk of loss.