Abstract:
- Though tech stocks often blur the line between quality and growth, these factors are not the same. Quality has shielded portfolios from downside far better than fundamental growth factors, resulting in considerably better performance.
- Growth has done very well off the March low, as the market has focused more on fundamental growth and has been concerned about the profitability of tech segments likely to be disrupted by AI, but quality has the better long term track record.
- Tech stocks are often some of the most profitable and highest growth stocks in the market, but not always. Overall, quality is much more concentrated in industrials and financials stocks than tech while growth tilts more toward health care currently.
AI Disruption Has Growth Leading Quality, but It is Likely Short Term
Though tech and fast-growing stocks have blurred the lines between quality and growth factors, the two show different performance over time – most especially during downdrafts. Growth factors usually comprise some form of fundamentals, measuring EPS or sales growth, for example, on a trailing or forward basis. In contrast, quality metrics like ROE and ROIC attempt to determine how effective a company is at deploying capital. Growth stocks have led in the 2Q recovery and are now topping quality factors in year-to-date performance, as dispersion in the AI trade has deepened with extraordinary capital spending guidance as well as rapid development of the technology itself. The factors can often overlap as earnings or operating earnings growth will bolster the numerator of traditional quality metrics, and this overlap group has performed well in the narrowly focused post-ceasefire rally in stocks. Nonetheless, quality factors – ROE and ROIC – have a better track record in drawdowns and have thus recorded superior performance over the long run.
Slow And Steady Quality Wins the Long-Term Race
Growth stocks have come roaring back from their March lows and are now topping quality factors so far this year. Year to date, forward EPS growth has risen the most, up 16.9%. Forward sales growth is next (up 12.8%) while ROE and ROIC are up just 4.5% and 5.2%, respectively. Though recent gains are impressive, they still do little to offset the nearly 200 percentage point underperformance of the EPS growth factor versus quality peers or the roughly 400 percentage point lag for sales growth relative to ROE and ROIC over the longer run (since the end of the financial crisis).

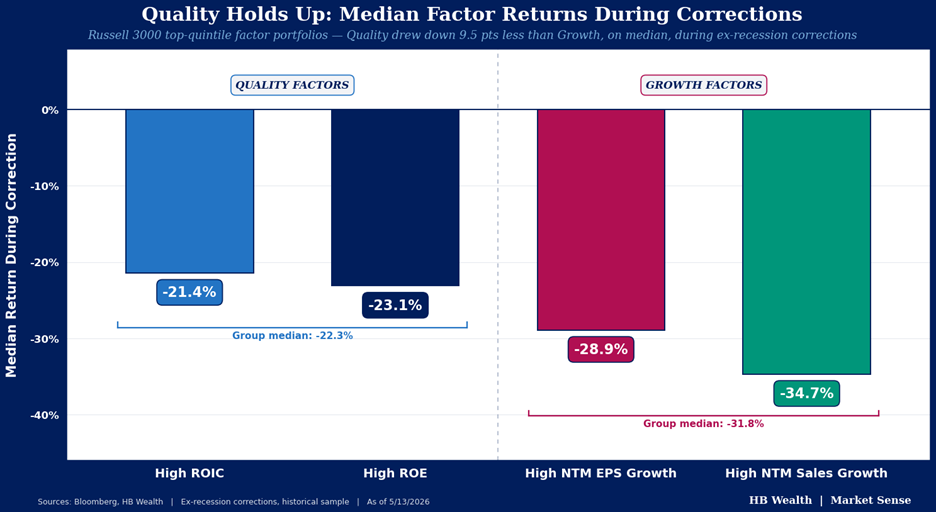
The resilience of the quality factor most recently manifested during the selloff that accompanied the conflict in Iran. From the February 28th level, Russell 3000 high ROE and ROIC stocks dropped 7.5% each through the March 30 low versus the decline of 10% for the one-year forward sales growth factor. The EPS growth factor performed a touch better. That behavior is typical – going back to the Great Financial Crisis, quality factors (ROE and ROIC) have faced median downdrafts of just over 20% during major corrections (drops of 15% or more excluding recessions). Growth factors (one-year forward sales and EPS growth) have suffered much more, falling on median about 30%.
Slow And Steady Quality Wins the Long-Term Race
While there is some overlap between the quality and growth factors in the S&P 500 index, they’re still quite diverse. Less than 15% of stocks that are high ROE are also high sales and/or EPS growth stocks. Likewise, 15.6% of top ROIC companies overlap with the upper echelon of stocks with high year ahead sales growth and just 6.8% are also high forward EPS growth stocks.
At the sector level, things get more interesting. Industrials and financials make up the largest share of the quality factors while health care is the biggest sector in the growth factors. But tech stocks make up the greatest share of overlap between quality and growth, in the 20-30% range for each factor crossing. The stocks that are both high quality and high growth have performed extremely well in the post-March bounce. High ROE stocks that are also high EPS growth stocks’ median YTD gain is 17.7%, more than double the market return of just under 9%. Off the March low, high ROE and high year ahead EPS growth stocks were up a median 21.4%, and high ROIC and high sales growth stocks were also up a median 20.2%, both outperforming the broad index gain of 17.4%.
A major contributing factor to the crossover group’s outperformance is the significantly lower software weight in growth – ROE and ROIC carry higher weights to software than the overlap group. Likewise, there are very few semiconductors stocks that qualify for quality inclusion, and this group has led the rally off the March low for the index as a whole. As we noted in our piece dedicated to the break-up of the Mag-7 trade (A Deep Dive: Magnificent-Seven’s Breakup Continues Amid Capex Boom – HB Wealth), disruptions in the tech sector – software most severely – may continue to alter the performance dynamic for the market at large. As some of the disrupted stocks were also some of the highest ROE and ROIC stocks in the index last year, they have been holding back the quality factor in the short term. In fact, the industry’s performance was quite different across quality and growth factors – in both quality bins software was down roughly 21% while it slipped just 2.5% and 15% in the sales and EPS growth factor as investors’ penchant for growth has helped mitigate some AI concerns. Meanwhile, as the market has rotated toward a preference for near term fundamental growth beneficiaries of hyperscaler investment, led by semiconductors, further distorting the quality/growth performance dynamic. Finally, out of favor but highly profitable financials and health care companies are also weighing on the relative performance of quality in the narrow, growth-centric post-ceasefire bounce. In the long run, quality factors are still outperforming growth factors by a wide margin. Growth has dominated in recent weeks, but as the market works through expectations for the impact of AI investment, quality should resume leadership.
Disclosure: HB Wealth is an SEC registered investment adviser. The information reflects the author’s views, opinions, and analyses as the publication date. The information is provided for informational purposes only and does not constitute an offer to sell or a solicitation of an offer to buy any investment product. This information contains forward-looking statements, predictions, and forecasts (“forward-looking statements”) concerning the belief and opinions in respect to the future. Forward-looking statements involve risks and uncertainties, and undue reliance should not be placed on them. There can be no assurance that forward-looking statements will prove to be accurate, and actual results and future events could differ materially from those anticipated in such statements. The information does not represent legal, tax, accounting, or investment advice; recipients should consult their respective advisors regarding such matters. Certain information herein is based on third-party sources believed to be reliable, but which have not been independently verified. Past performance is not a guarantee or indicator of future results; inherent in any investment is the risk of loss.