








Abstract:
- Another strong earnings season is on tap for the S&P 500, but risks are beginning to mount beneath the surface, threatening the broadening trade that has been the story of the last year.
- The S&P 500 is expected to post 24.7% EPS growth on 12.2% revenue growth in 3Q. Companies will need to confirm that 3Q strength will continue in the year ahead to improve market breadth and reinvigorate the bull trend.
- Energy and tech are expected to dominate, with the two sectors contributing 85%, of the S&P 500’s expected 24.9% earnings growth in Q3, up from 2/3rds of growth year to date. We are watching revision momentum for the 493 ex-tech and energy as well as small caps as keys to reinvigorate the broadening trend.
- Overall earnings breadth and margin estimates also need to keep rising to sustain the bull trend in stocks at large. Keys to success at the sector level are likely to be found in tech, energy consumers and financials.
- Much like last season, the bar for AI and tech-related stocks is sky high and dependent on continued capex from the Magnificent-7 hyperscalers. Meanwhile, elevated fuel prices are quickly becoming a thorn in the side of consumer and input cost heavy sectors. Finally, the bond market is altering the outlook for rate sensitive and highly levered groups.
The 493 is Expected to Lead Earnings Growth, But Not Without Energy
Consensus expects the S&P 500 to post 24.7% EPS growth on 12.2% revenue growth in 3Q but those headline numbers are hiding a lot of crosscurrents. Odd bedfellows, energy and tech, are expected to lead S&P 500 earnings growth (as they did in 2Q) and while every sector is expected to contribute to growth this quarter, seven of eleven GICS groups look unlikely to crack double-digit EPS growth. Excluding tech and energy would thus result in just 5.3% earnings growth, down from 13.3% in 2Q. This demonstrates the unique confluence of risks now facing fundamentals as higher energy prices benefit that sector but eat away at profitability elsewhere, all while tech remains in an AI-fueled super-cycle.
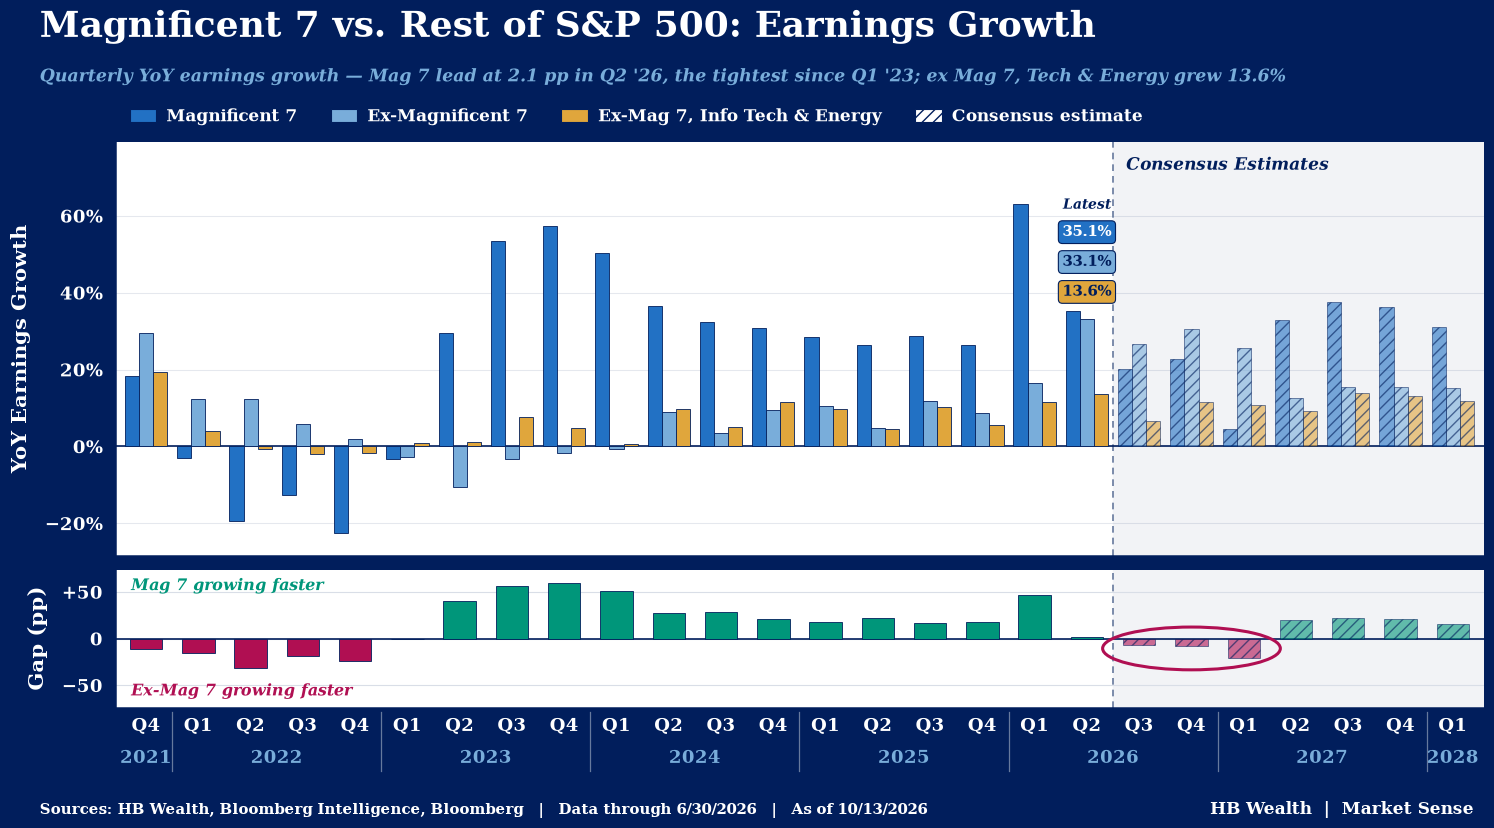
Likewise, renewed interest in the magnificent-7 stocks comes just as earnings for that group (and tech at large) look to be more shielded from macro risks than the rest of the index. Consensus expects the other 493 stocks in the S&P 500 to post 26.4% EPS growth to the magnificent-7’s 20.6% and maintain a lead over the mega-cap cohort through 1Q27. That would generally support the broadening trade that emerged this year, but the gain is extremely concentrated in energy and tech sectors. The 493 excluding tech and energy are expected to post a paltry 6.5% EPS growth in 3Q – a significant deceleration in growth from the 1H average pace of 12.6% and follow that with just 9.5% quarterly earnings growth over the next year. This might pale in comparison to the 15.8% earnings gain for the magnificent-7 and result in continued loss of momentum for 2026’s broadening trade.
Investors are reacting quickly to these emerging trends under the surface. The 493 have been struggling heavily relative to the Mag-7 over the last month, particularly when energy and tech are excluded. Not only are the 493 losing steam, but their growth burst relative to the Mag-7 appears to be temporary. Magnificent-7 earnings growth could bottom as early as 1Q27 – the same quarter that marks the peak gap between the cohort and the other 493 (at an expected 2,158 bps).
Estimate Revision and Small Cap Details Reveal Risks Under the Surface
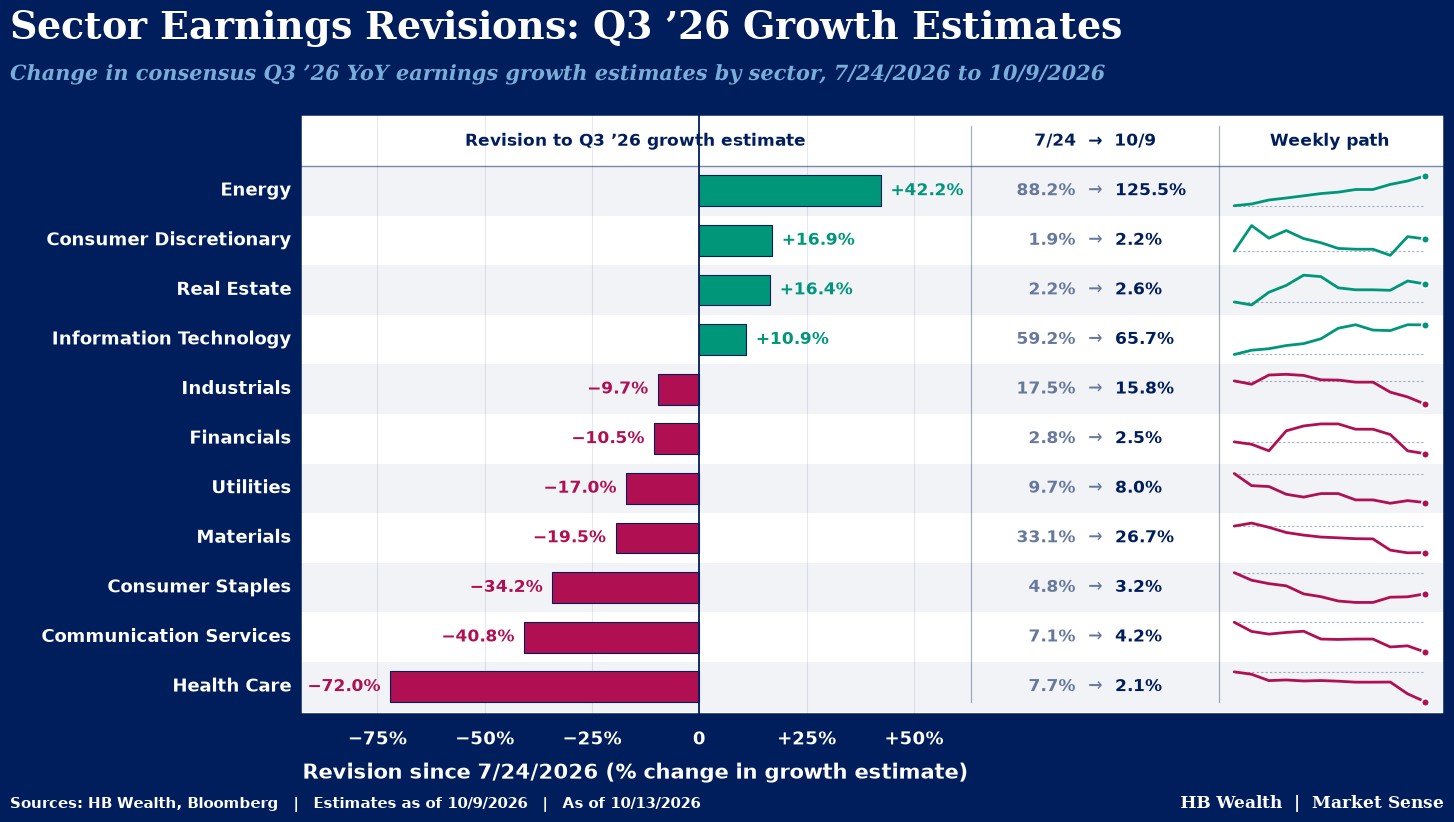
Over the past three months, the sell side has raised S&P 500 index 3Q revenue and EPS forecasts by 156 and 165 bps, respectively, but this is far from representative of the trends beneath the headline. Energy has by far had the biggest increase to this quarter’s EPS forecast, up nearly 40 percentage points over the same time as oil prices have remained elevated. Tech had the next largest upward revision, followed by discretionary and real estate. However, all other sectors have faced cuts, led by materials, health care, and communications. That weakening sector revision breadth has likewise pushed revision momentum (the percentage of companies with hikes minus those with cuts over the total with estimates) to negative for the S&P 500. Estimate revisions for sectors outside of tech and energy will likely need to turnaround to revive the broadening trade.
Tech, energy consumers and financials could be the sectors to watch most closely for the market’s interpretation of success this season. Much like last season, the bar for AI and tech-related stocks is sky high and dependent on continued capex from the Magnificent-7 hyperscalers. While their results have remained strong, shrinking free cash flow will keep return on investment concerns under the microscope as investors look for signs of slowing spending, and stocks may be shaken by anything short of perfection. Elevated fuel prices promise to play a bigger role this season than last – they are quickly becoming a thorn in the side of consumer and input cost heavy sectors and could continue to rattle faith in the broad-based equity rally that helped power much of this year’s advance. Finally, the bond market is quickly altering the outlook for rate sensitive and highly levered groups like financials, real estate and utilities. The KBW bank index is down more than 10% from highs, suggesting financials performance may hinge on big-bank earnings – equity trading, IPOs and deal activity may need to provide air cover from any rate-volatility issues in lending and FICC trading.
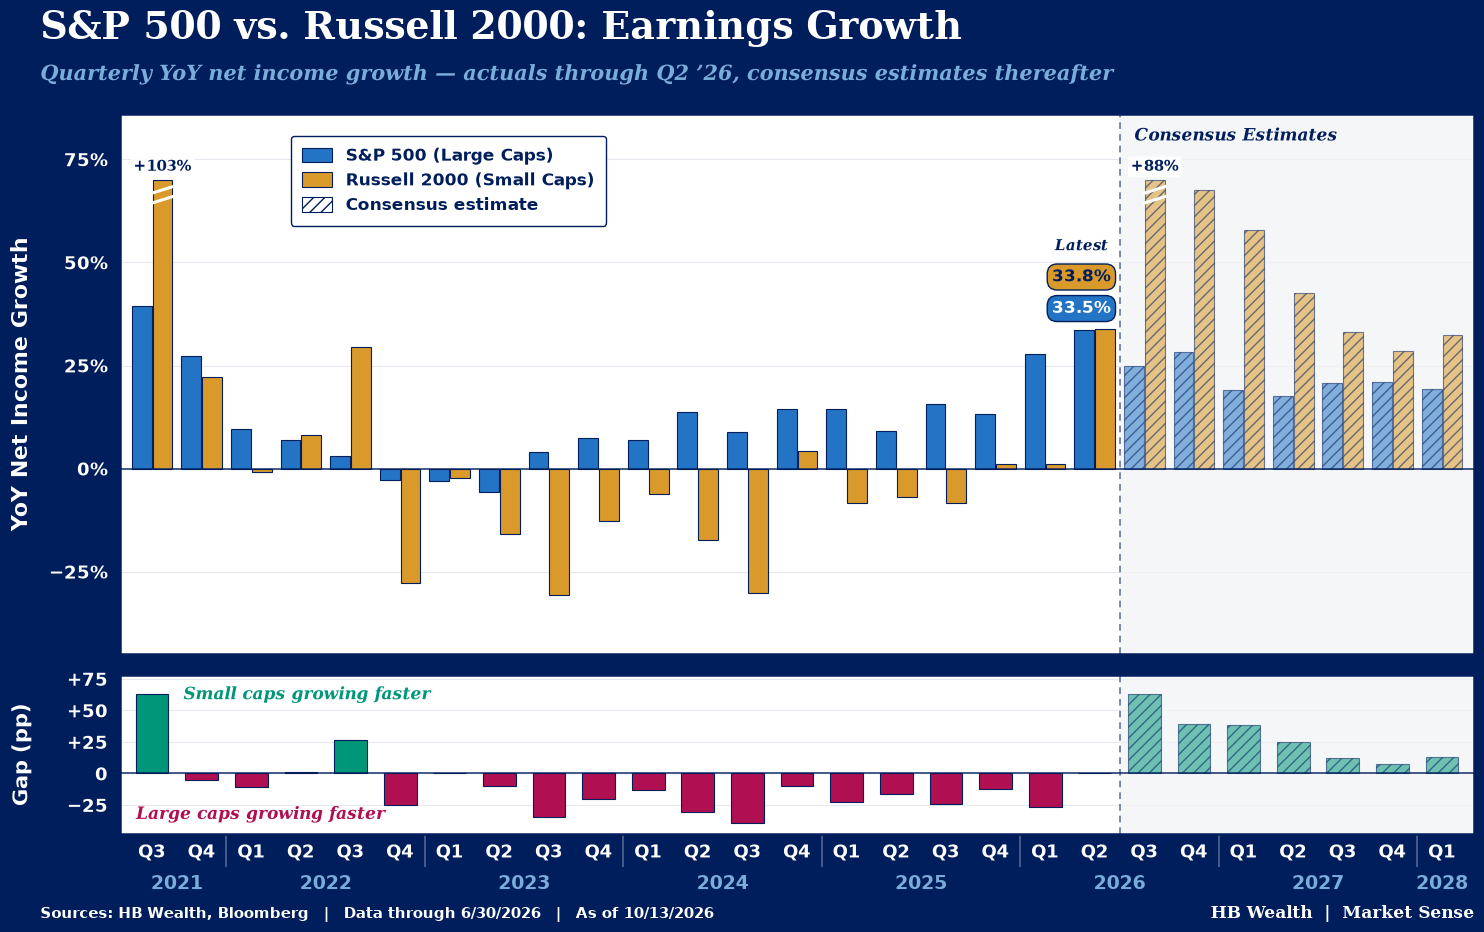
Small cap stocks have also been key to the broad market broadening trend this year, but are struggling under the weight of higher interest rates and high energy costs at this time. The Russell 2000 is expected to post strong revenue and earnings growth this quarter, but the gauge’s topline momentum also appears to be slowing – likely making it challenging for small caps to keep outperforming unless they post significant beats that force the sell side to raise forecasts. Currently, analysts expect 8% topline growth this quarter, up from 7.7% just three months ago. Energy and materials are expected to post the strongest growth while staples and financials could be the weakest. Likewise, this quarter looks to mark peak net income growth for the small cap gauge, up 88% to the S&P 500’s 24.9%. While the Russell 2000 is expected to continue to lead the large cap index’s earnings growth pace into 2027, slowing earnings momentum could weigh unless surprises mount.
Near Best it Can Get Earnings Breadth and Margins Sustain Equity Bull
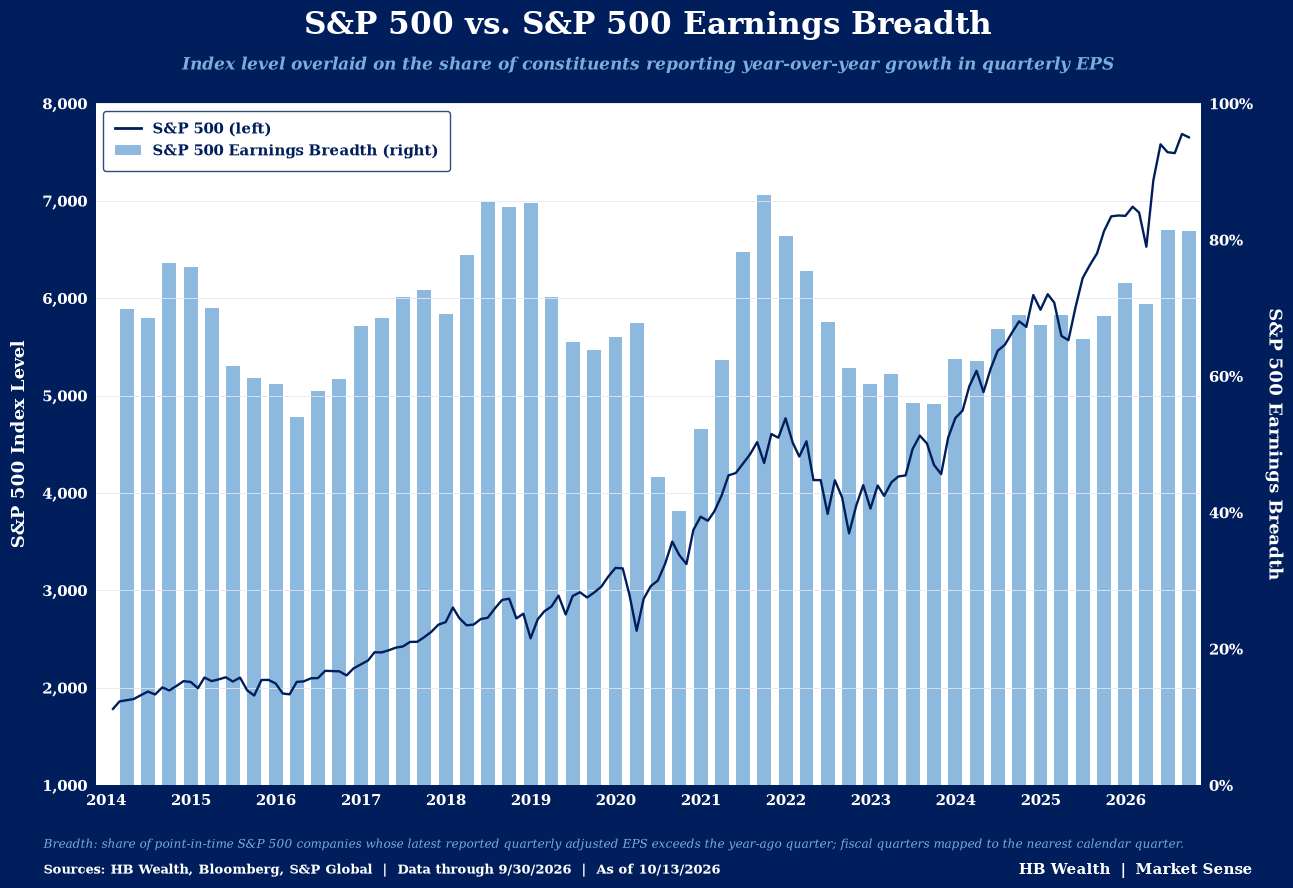
Two other keys to watch this earnings season are earnings breadth and margin forecasts – critical supports for the bull trend in the S&P 500. Earnings breadth – the percentage of S&P 500 companies posting earnings growth year-over-year – has improved throughout 2026, helping to support the bull run and broadening trade but it’s getting near levels where it historically topped out. It will likely have to sustain at or above these levels for participation to avoid narrowing even more. In 2Q, earnings breadth hit 82.6%, its second consecutive reading north of 80% and just shy of the 86% peak during the recovery from the covid-19 recession in 2021 and the roughly 88% apex sustained in 1Q-3Q18 in the wake of the Tax Cuts and Jobs Act. With growth slowing sequentially in eight of 11 GICS sectors, expecting earnings breadth to remain as robust as last quarter might be a tall order.
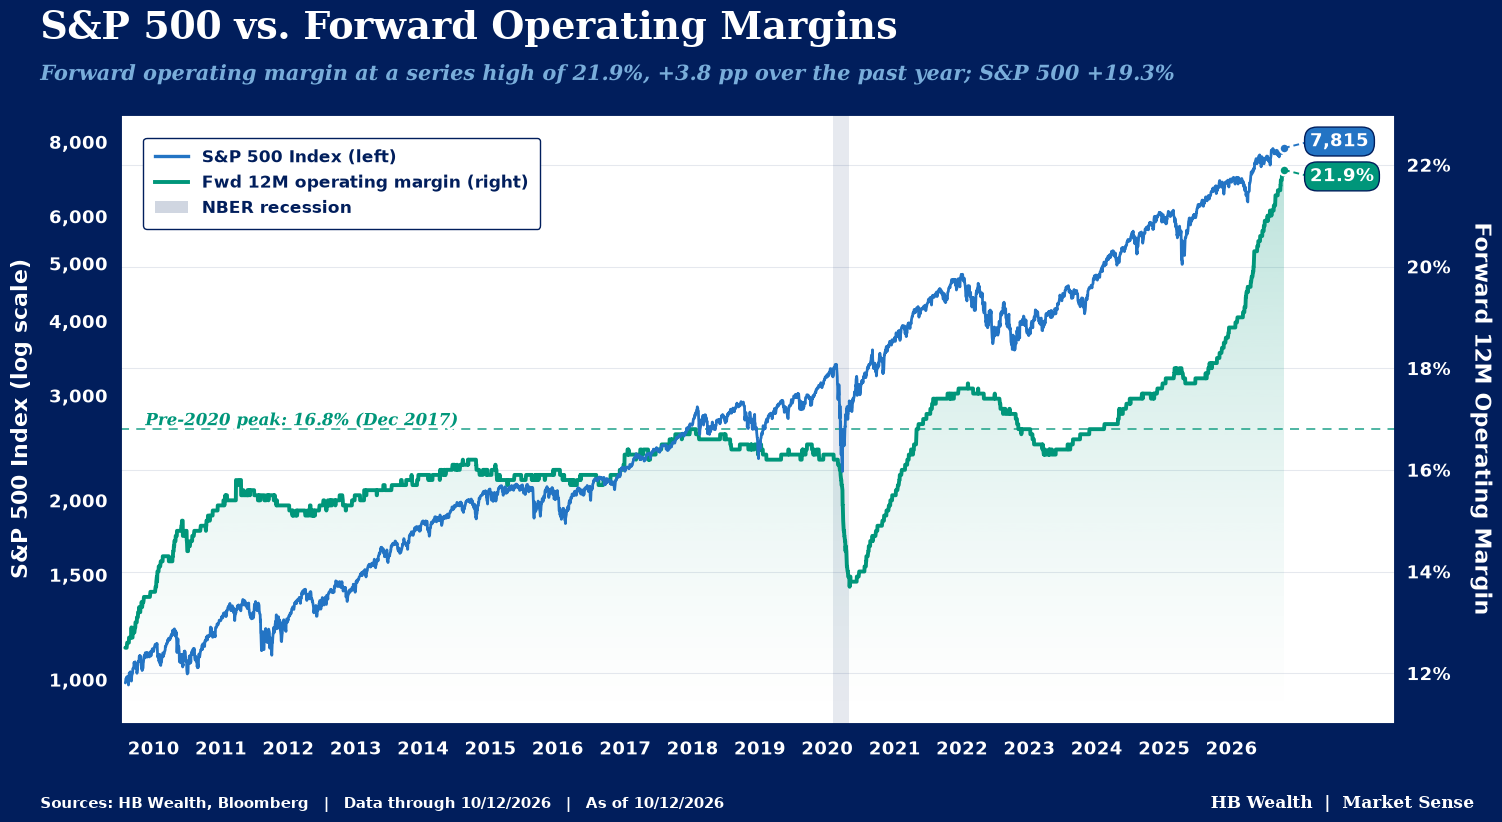
Rapidly rising operating margin forecasts have likewise helped sustain the S&P 500 bull run. Since the start of the year, S&P 500 operating margin forecasts have risen 300 bps – the most on record of similar-length periods outside of the immediate recovery from the Great Financial Crisis. However, it’s up for debate how long this tailwind could possibly persist given ongoing economic headwinds. Tech is driving most of the optimism with 3Q operating margins expected to expand 546 bps over the year-ago mark and continued acceleration into 2028 – benefiting from extremely strong demand from the AI-build out.
Excluding tech, operating margins are still expected to rise, though only by 189 bps over the year ago mark and forecasts suggest profitability is likely to improve throughout 2027.
Typically, when PPI is above CPI – as it has been for much of the year – operating margin forecasts tend to struggle. Rising fuel costs now threaten margin forecasts for input cost heavy industries and topline for consumer discretionary and staples, raising the risk of downward revisions. So far, the sell side is optimistic for operating margins but mixed on the sector outlook – they think energy-price tailwinds should abate going forward, resulting in shrinking energy-sector margins, and forward forecasts for utilities and staples are relatively flat. The rest of sectors are expected to see margins continue to trend higher, led by tech. Nonetheless, the possibility of margin compression outside tech is a risk to watch given building headwinds.
Disclosure: HB Wealth is an SEC‑registered investment adviser. The information reflects the author’s views, opinions, and analyses as the publication date. The information is provided for informational purposes only and does not constitute an offer to sell or a solicitation of an offer to buy any investment product. This information contains forward-looking statements, predictions, and forecasts (“forward-looking statements”) concerning the belief and opinions in respect to the future. Forward-looking statements involve risks and uncertainties, and undue reliance should not be placed on them. There can be no assurance that forward-looking statements will prove to be accurate, and actual results and future events could differ materially from those anticipated in such statements. The information does not represent legal, tax, accounting, or investment advice; recipients should consult their respective advisors regarding such matters. Certain information herein is based on third-party sources believed to be reliable, but which have not been independently verified. Past performance is not a guarantee or indicator of future results; inherent in any investment is the risk of loss.