Abstract:
The Magnificent Seven has managed to recover its year-to-date loss with April’s rally, though most stock prices in the group remain below former peaks as the market continues to work through likely outcomes of the group’s tremendous investment in AI. Pairwise correlations are likewise dropping, demonstrating the breakup of the trade.
Mag-7 earnings growth rose more than 50%, lapping street consensus, though reactions were mixed as spending plans and ROIs fell under the microscope. Consensus intriguingly doesn’t see 1Q as a sign of things to come, but instead an outlier, and is baking in deceleration throughout the rest of the year.
Weighted average cost of capital (WACC) is on the rise for the group at large, though its mostly equity funding that’s gotten more expensive. We’re watching the spread between ROIC and WACC to determine when spending plans might need to be curtailed a bit.
As a whole, the Mag-7 has clawed back all of their aggregate stock price loss from their October 2025 peak, even as valuations remain down more than 15% for the group thanks to an extraordinary earnings gain of 50% YoY for the group in 1Q. However, dispersion of returns remains extremely wide – Alphabet and Amazon stocks have managed positive returns of +36% and +12%, respectively, since the group peak last October, while Nvidia is flat, and Microsoft, Meta and Tesla stocks are all down 20-25%. On a rolling 52-week basis, pairwise correlations have dropped to 0.31 from 0.58 at the recent high on June 17, 2025, as the Magnificent-7 trade is going through its breakup.
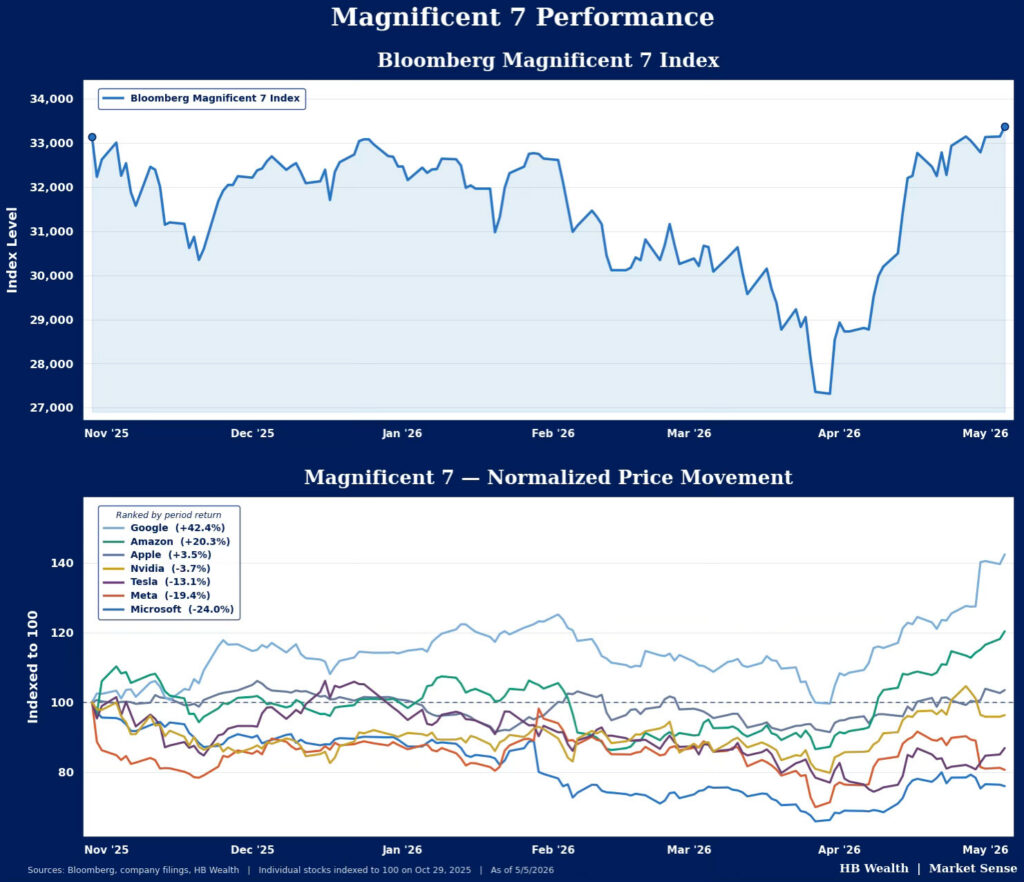
The Magnificent-7 posted extraordinarily strong earnings growth that more than doubled consensus forecasts in 1Q, helping to explain why some of the stocks have jumped back into leadership within the S&P 500. Intriguingly, the consensus (so far) sees this surge in growth as somewhat temporary. The group is projected to continue to out-earn its S&P 500 competitors next quarter, but less profoundly, with projected net income growth of 26% versus 20% for the other 493 S&P 500 stocks, before slowing its pace of growth to fall short of the ex-mag 7 stocks in the second half of 2026. Current quarter EPS growth was very broad based with only Tesla posting an earnings gain in the single digits, at 5.9% YoY. The expected deceleration in earnings growth from 2Q26 onward also appears to be broad based as well, though rocky forecasts for Meta and some difficult comparisons for Amazon are the main culprits behind the expected future deceleration in growth.

Stock Prices are Moving with Return on AI Investment
Four of the so-called AI-Hyperscalers within the Magnificent Seven (META, MSFT, AMZN, GOOGL) all beat expectations for headline earnings growth, and all of them also raised capital expenditure expectations for 2026 in the ever-growing AI infrastructure build-out. However, the market did not reward all of these earnings beats and capex-raises. Hyperscalers are now forecast to spend $760bn in capex in 2026 – 71.8% above 2025’s run rate. That could expand another 33.6% to a whopping $1015bn in 2027. Over the next two years Microsoft and Google are expected to show the greatest growth in spending.
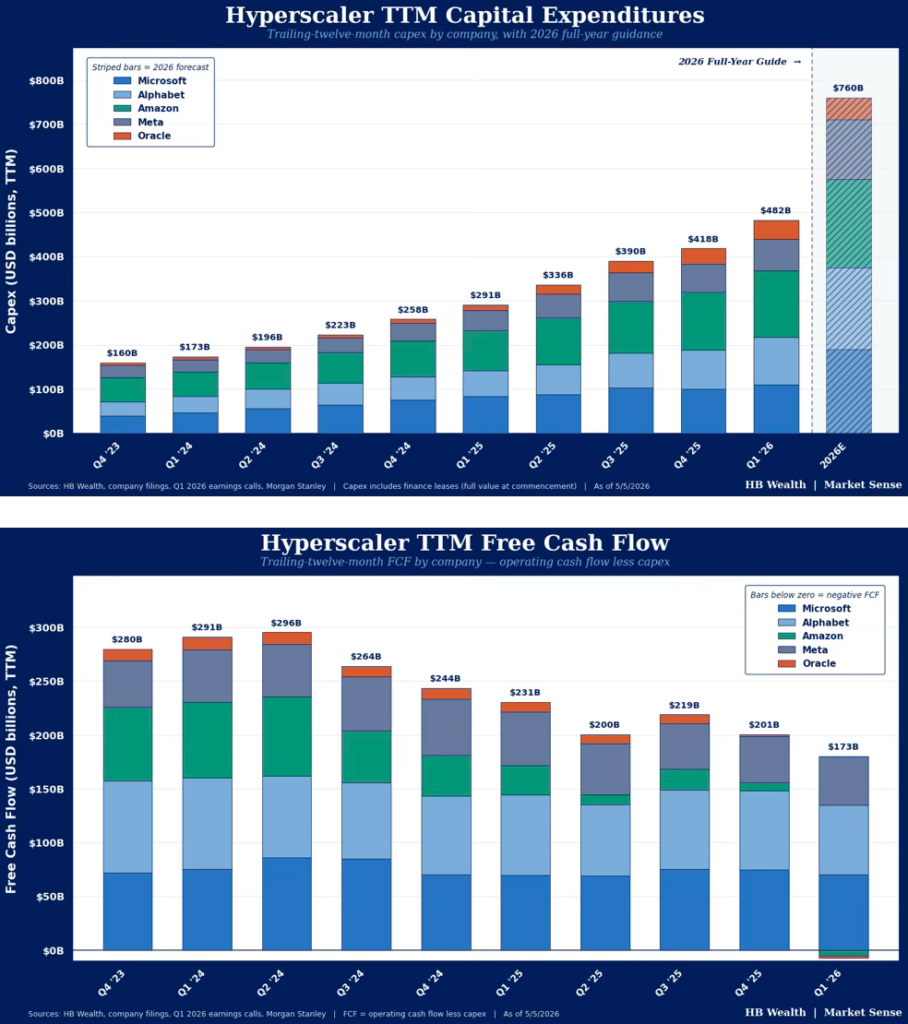
These extraordinary plans for investment were not universally greeted as positive news by the market. With AI spending continuing to rise and return on investment still limited, uncertainty around declining free cash flow and profitability of these investments has started to emerge. Amazon joined Oracle in negative free cash flow territory, resulting in another quarter of decelerating free cash flow for the group as a whole. Group free cash flow was $173 billion, but this was down 25% YoY in 1Q, an acceleration in the rate of decline from 18% in 4Q25. Trailing four quarter FCF was also down more than 20%.
Looking for ROI on AI: Revenue and WACC Are Breadcrumbs to Follow
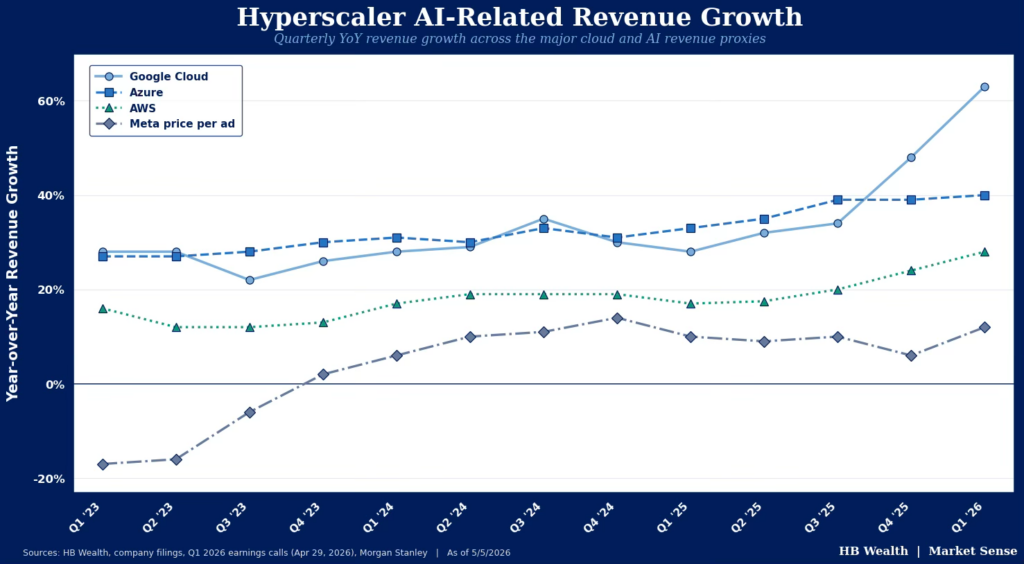
As a result of this cash flow deterioration, indicators of ROI now appear to be the primary driver of stock price movements for the group. Among them, revenue specifically tied to AI appeared especially tied to stock price movements in this quarter’s earnings season. Alphabet posted an enormous +9% rally following earnings, as revenue coming from Google Cloud grew 63% over the past year, more than doubling its annual growth rate a year ago. The cloud backlog nearly doubled sequentially to $462B. Although they raised 2026 capital expenditures, Google had the revenue growth to back it up. Amazon likewise posted a particularly strong quarter with cloud growth surging to its fastest pace in nearly three years, and the stock rose 1.3% in the day following the release. While its AI-spending plans likely weighed on investor reactions (it projected capex to be $200bn in 2026), its additional investment in Anthropic and strategic partnership with OpenAI eased some concerns.
The theme across magnificent-7 underperformers was consistent – structural shifts in capex or signs of margin compression were met with consternation. Microsoft slipped nearly 4% in the day after it reported despite beating across the board as gross margins hit the lowest level in nearly 3 years and operating margins declined sequentially thanks to their aggressive data center build out. Meta likewise sunk nearly 9% in the day after its earnings release, as investors homed in on dramatically higher AI-capex guidance that has yet to deliver much return. Tesla rose initially as investors dialed into their earnings call but gains were wiped out as the company announced $5bn higher capex guidance for 2026 (a 25% increase versus prior guidance) to support an AI pivot that is unlikely to deliver any return this year.
Given the increasing cost of the AI buildout for these companies, a comparison of return on invested capital (ROIC) to weighted average cost of capital (WACC) across the magnificent-7’s hyperscalers could help identify which companies might soon need to curtail their spending plans. On median, the magnificent-7’s hyperscalers – Microsoft, Alphabet, Meta and Amazon – have an ROIC of 24.4% and WACC of 12.4%. That 12-percentage point spread is down from the 17.4 gap in June 2025 as hyperscalers’ cost of capital has risen as a function of relatively higher treasury yields and equity risk premiums that have driven a recent shift toward cheaper debt funding. Of those companies, only Amazon has a negative spread between ROIC and WACC, suggesting the company is not creating value for shareholders with additional spending. (That reading is at the company level and likely does not reflect the return on investment (ROI) for their various AI projects.) Still, aggregate measures of economic value added – the difference between ROIC and WACC – could highlight impending slowdowns in cash flow generation and spending.

Disclosure: HB Wealth is an SEC registered investment adviser. The information reflects the author’s views, opinions, and analyses as the publication date. The information is provided for informational purposes only and does not constitute an offer to sell or a solicitation of an offer to buy any investment product. This information contains forward-looking statements, predictions, and forecasts (“forward-looking statements”) concerning the belief and opinions in respect to the future. Forward-looking statements involve risks and uncertainties, and undue reliance should not be placed on them. There can be no assurance that forward-looking statements will prove to be accurate, and actual results and future events could differ materially from those anticipated in such statements. The information does not represent legal, tax, accounting, or investment advice; recipients should consult their respective advisors regarding such matters. Certain information herein is based on third-party sources believed to be reliable, but which have not been independently verified. Past performance is not a guarantee or indicator of future results; inherent in any investment is the risk of loss.