








Abstract:
- Bond yields continue to rise across the curve, dampening the outlook for equity market valuations and increasing risk to near term returns for stocks, but the bigger picture signal from the bond market may be about surging growth.
- With large cap stocks’ dependence on leverage still low but rising with the AI-investment boom, any negative equity market impacts of higher yields should remain somewhat limited, with the 1994 and 2023 yield surge experiences providing useful historical reference points for evaluating current market conditions. In each instance, the S&P 500 sold off about 10%, led by small caps and value.
- While the S&P 500 has taken the bond market blows in stride so far, a look under the hood shows the historical comparison appears directionally consistent with current market trends – more than 50% of stocks in the index are now trading below their 200-day moving average, as large cap stocks are losing momentum, large cap value stocks have sold off 3%, and small cap shares have sold off 8% from peak.
- As for bonds, the multi-year reset in yields may continue, but losses may slow as yields approach longer term averages. The extreme surge over the last six months appears less extreme when compared to bond market history, and combined with yields back near long term norms, this may only indicate slightly lower than average, rather than negative returns, ahead.
Bond Markets Approach Long Term Norms, Surge Mostly on Improving Growth Outlook
Rates across the Treasury curve are one the rise, with the 5-year Treasury bond above 5% for the first time since June 2007 after a poor auction showed limited demand for the tenor, the 10-year Treasury now at 5.24%, and 30-year bond yields approaching levels last recorded in 2002. A plethora of issues are currently adjusting supply and demand dynamics; fiscal imbalances, tightening fed policy, competition from corporate issuance, rising global yields and oil prices, persistent inflation pressures, and improving growth prospects are all at once pressuring bond yields higher.
However, exhibited by the spread between benchmark yields and bond market implied inflation expectations, real yields are the primary reason interest rates are moving higher, as inflation breakevens across tenors remain contained, and well below spring highs. Other factors may also remain drivers of bond yields, but the signals from the market itself suggest that strengthening macroeconomic growth, not embedded inflation risk, may be the predominant driver of yields at this time.
Two Bond Yield Surges – 2023 and 1994 – Set Stage for What to Expect in Stocks
While the S&P 500 has taken the bond market blows in stride so far, a look under the hood and at the broader markets shows a significant breakdown may be starting to emerge. More than 50% of stocks in the index are now trading below their 200-day moving average as few large cap stocks are maintaining momentum, large cap value stocks have sold off 3%, and small cap shares have sold off 8% from peak.
These cross-market signals are consistent with market experiences in 2023 and 1994, when stocks also struggled with bond market resets. In 2023, the 10-year Treasury yield rose from 3.3% to 5%, making waves for stocks from late July to late October that year. Value underperformed growth, small caps underperformed large caps, and Mag-7 stocks helped offset losses in non-Mag 7 stocks in 2023’s peak to trough correction of 10% in the S&P 500. Stocks still managed a stellar gain of 26% that year.
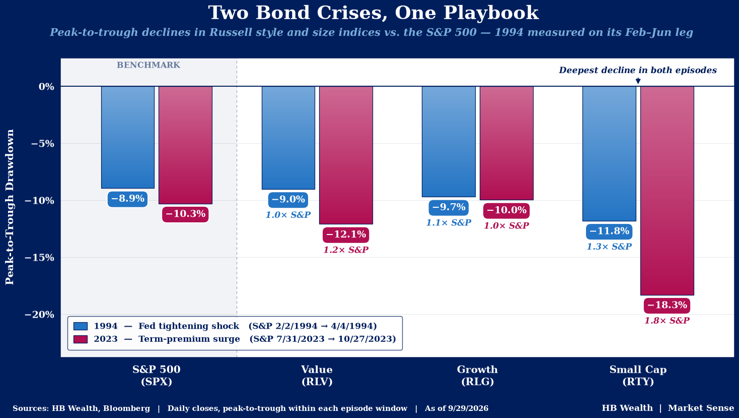
1994 was a little more challenging for equities overall, even though the peak-to-trough drawdown and leadership shifts were eerily similar to those of 2023. As the Federal Open Market Committee tightened short term interest rates from 3% to 6% in 1994, yields across the Treasury curve reset, with the 10-year yield rising from 5.6% to 8% over the course of that year. The curve – both the 10-year/2-year Treasury and 10-year/3-month Treasury yield spreads – nearly inverted by the end of the rate reset. Stocks struggled early on, and the S&P 500 dropped nearly 10% from peak to trough. The index turned in a modest loss of about 1% that year.
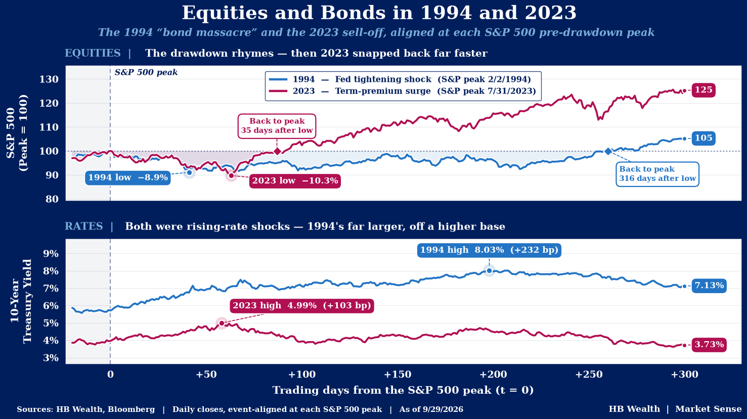
While leadership within the market was similar in each experience (ie, large outperformed small, growth did better than value) and the drawdowns were similar, the 1994 experience was more difficult for stocks given it took longer to recover from. Part of the reason for this was the extent of the bond market move. Bond yields rose substantially more in the 1994 experience than in the 2023 experience, and over a longer time period, ultimately weighing on stocks’ recovery from their initial decline.
Equities’ Valuations Remain at Risk, as Stocks Lean on Earnings to Drive Returns
In both 1994 and 2023, the bond market selloff was not large enough to topple growth prospects, and the current signal from rising real yields suggests the same may be in store this year. If bond markets are indeed primarily repricing a stronger economic growth outlook, this is consistent with an environment of strong earnings growth and suggests the downside risk for equities from the bond market will likely be concentrated on the rising discount rate (thus valuations) and the rising cost of capital. That is, unless the increase in yields materially slows topline growth, at which point earnings growth rates are directly slowed.
We covered the impact of higher yields on valuations in a recent Market Sense note, (Bonds Breaking Barriers Change Stocks’ Driver, Not Necessarily Their Direction) suggesting increasing yields will likely continue to result in valuation pressure on the index. The other two mechanisms by which bonds can impact equities – through the cost of funds and by slowing revenue growth, are worth monitoring, but both seem substantially less likely to emerge imminently, even with bonds yields pressing to new highs.
S&P 500 debt levels and interest expenses are rising, but at an extremely slow pace relative to earnings, and as yet show no evidence of strain as interest rates rise. Total debt to EBITDA sits at just 3.4x, nearly its lowest level since 2009 and well below the 7.1x at the height of the 1999-2000 tech bubble. Likewise, revenue growth may slow relative to its current breakneck pace but it is nonetheless expected to expand about 10% over the next year, still faster than any year of the pre-pandemic era. Thus, the impact rising rates have on stocks could come down to if they drive a slowdown in topline growth, via a pullback in demand, that ultimately limits operating earnings’ ability to cover growing interest expenses.
For Bonds, the Bulk of the Painful Reset is Likely Past
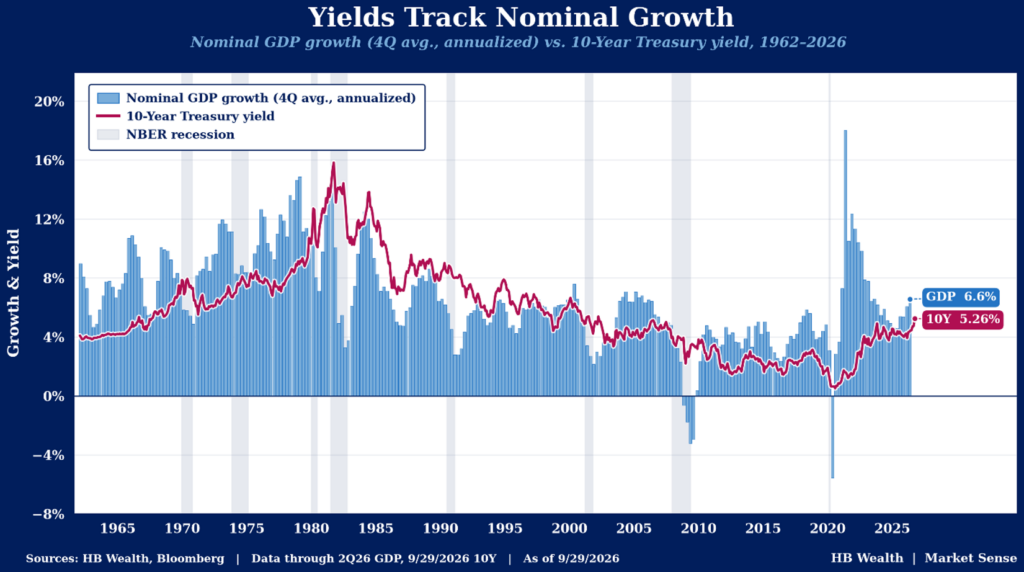
The repricing in the bond market has been extremely rapid, but not unheard of, historically, and much of the painful adjustment back to long term norms may now be in the past. Over the last five years, bonds have been through one of the largest bear markets in history, with yields repricing higher off of anomalously low levels recorded during the pandemic period. On average, the 10-year Treasury returned -3% per year over the last six years as yields rose from their all-time lows of 0.51% in 2020 to north of 5% this autumn. Notably, 5% yields remain on the low end of historical average for the bond market – the long-term average yield on the 10-year Treasury is 5.89% since the U.S. went off the gold standard in the early 1970s. Excluding the highly volatile 70s as well as the extremely low yields from the Great Financial Crisis until 2022, the long-term average is 6.97%. This leaves some room for bonds to continue to reprice just to get back to long term average.
If growth continues to surprise to the upside, that long term average may be in sight. However, as nominal GDP has risen from those pandemic lows, interest rates have moved right along with it, and nominal GDP merely confirms a 5-6% high for yields is likely for now. Nominal GDP has been recovering smartly and is currently on pace to rise between 5-6% this year. It is forecast to rise between 4-5% next year.
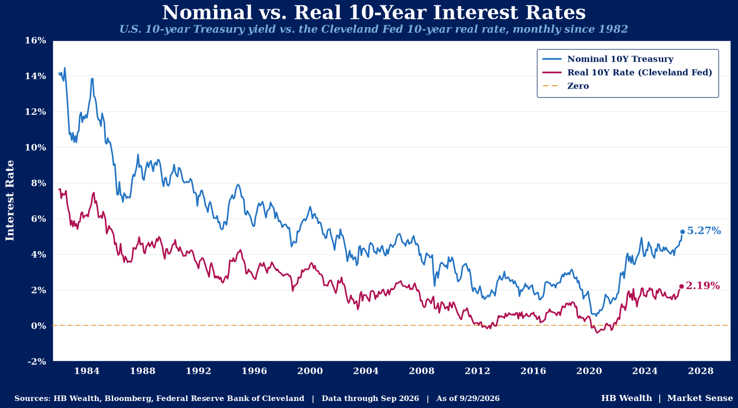
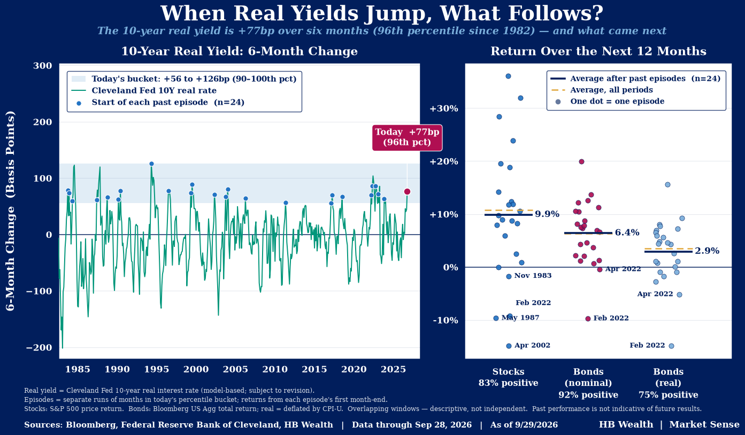
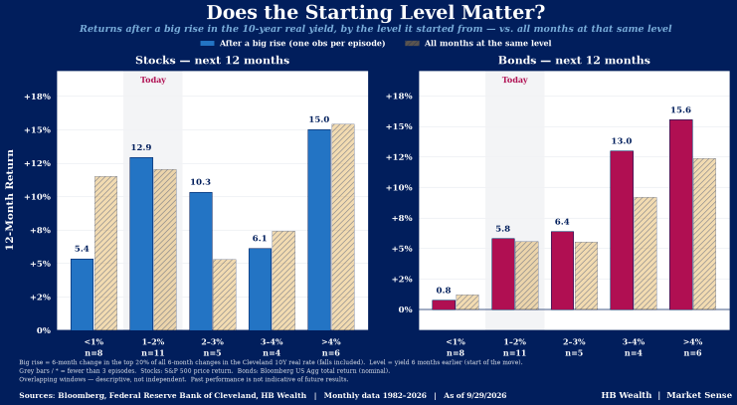
The recent acceleration in real yields has been quick but is also not unheard of in historical context, and may imply merely below average, rather than extremely poor, returns for both stocks and bonds over the next twelve months. Going back to 1982, the Cleveland Fed’s data on real yields shows the last six-month jump of 77bps is in the 96th percentile of history. There have been 22 other 10-year yield surges as large or larger over all former six-month periods. Bond market weakness following these extremes is notably rare – in the 12 months after other extreme jumps in real yields, stocks rose 11%, nominal 10-year Treasury yields fell 21bps and real 10-year yields fell 23bps, on average. While returns were slightly below long term average, negative 12-month returns for both stock and bond markets were outliers.
Even if yields keep climbing towards the longer-term average, the experience for investors would feel different than the recent example from 2023. The severity of the pain from that bond bear market came from the fact that starting yields provided no cushion against price losses, and that picture looks very different now. One way to quantify this is to look at how much rates can rise over the next year before a bond’s yield is fully offset by the price decline. When the 10-year Treasury was yielding roughly 0.5% with a duration nearly 10 years in 2020, the cushion was only around 5 basis points, so virtually any rise in yields assured loss. Currently the 10-year Treasury is yielding roughly 5.25% with a duration around 7.6 years, providing a cushion of around 70 basis points. That means yields can rise two thirds of a percentage point in a year and the 10-year Treasury will break even.
If the 10-year yield rises from the current 5.25% to the longer-term average 6.97% over three years, historical duration and yield assumptions suggest investors could still experience modestly positive returns during that period, at which point investors would be earning nearly 7%. With a reasonable level of yield present, fixed income is a self-repairing asset class, and this time we have much more of that self-repairing mechanism than we had a few years ago.
Disclosure: HB Wealth is an SEC-registered investment adviser. The information reflects the author’s views, opinions, and analyses as of the publication date. The information is provided for informational purposes only and does not constitute an offer to sell or a solicitation of an offer to buy any investment product. This information contains forward-looking statements, predictions, and forecasts (“forward-looking statements”) concerning beliefs and opinions with respect to future events, economic conditions, financial markets, and investment outcomes. Forward-looking statements involve risks and uncertainties, and undue reliance should not be placed on them. There can be no assurance that such statements will prove to be accurate, and actual results and future events could differ materially from those anticipated. The information does not represent legal, tax, accounting, or investment advice; recipients should consult their respective advisors regarding such matters. Certain information herein is based on third-party sources believed to be reliable, but which have not been independently verified. Historical market trends, relationships, correlations, and performance patterns discussed herein may not persist in future market environments. Investments in equities and fixed income securities involve risk, including market risk, interest-rate risk, credit risk, and the potential loss of principal. Investors should consider their individual objectives, risk tolerance, and financial circumstances before making any investment decision. Past performance is not a guarantee or indicator of future results.