








Abstract:
- Rapidly rising bond yields have been the driving force behind broad portfolio derisking that’s pushed small caps into correction. Given yields are behind the decline, small caps are likely to stabilize if the bond market calms.
- Today’s correction rhymes with parts of the 2022-23 bear market when rates roiled equities. No sector, style or factor has escaped unscathed but beta and leverage are leading the way lower again, showing rates are the source of indigestion. Profitability is holding up best as it did in the last bear market.
- However, small caps remain extremely discounted to larger stocks and critically, growth estimates are still marching higher. Average revenue growth for the next four quarters is expected to nearly double long-term norms – likely blunting the pain of higher yields this time.
- As long as forecasts continue to hold up, the correction likely creates opportunities in sectors that remain largely profitable but have been cast aside with the rest.
The Russell 2000 hit correction levels – down more than 10% from its mid-August high – even while the S&P 500 continues to hover within a stone’s throw of its apex. At least some of the move is attributable to the bond selloff as small caps peaked just before the 10-year yield broke out of its late summer range. Recall that we analyzed the Russell 2000’s reaction to rate hikes in the Market Sense from September 17th and found that cycles that were accompanied by larger moves in the 10-year were often the most volatile for the size. However, no sectors, styles or factors have really provided any shelter from the rout – hinting at a broad de-risking that is based almost purely on the move in rates. This implies a rebound for small caps may be contingent on stabilization in yields, particularly as valuations are now washed out for much of the index.
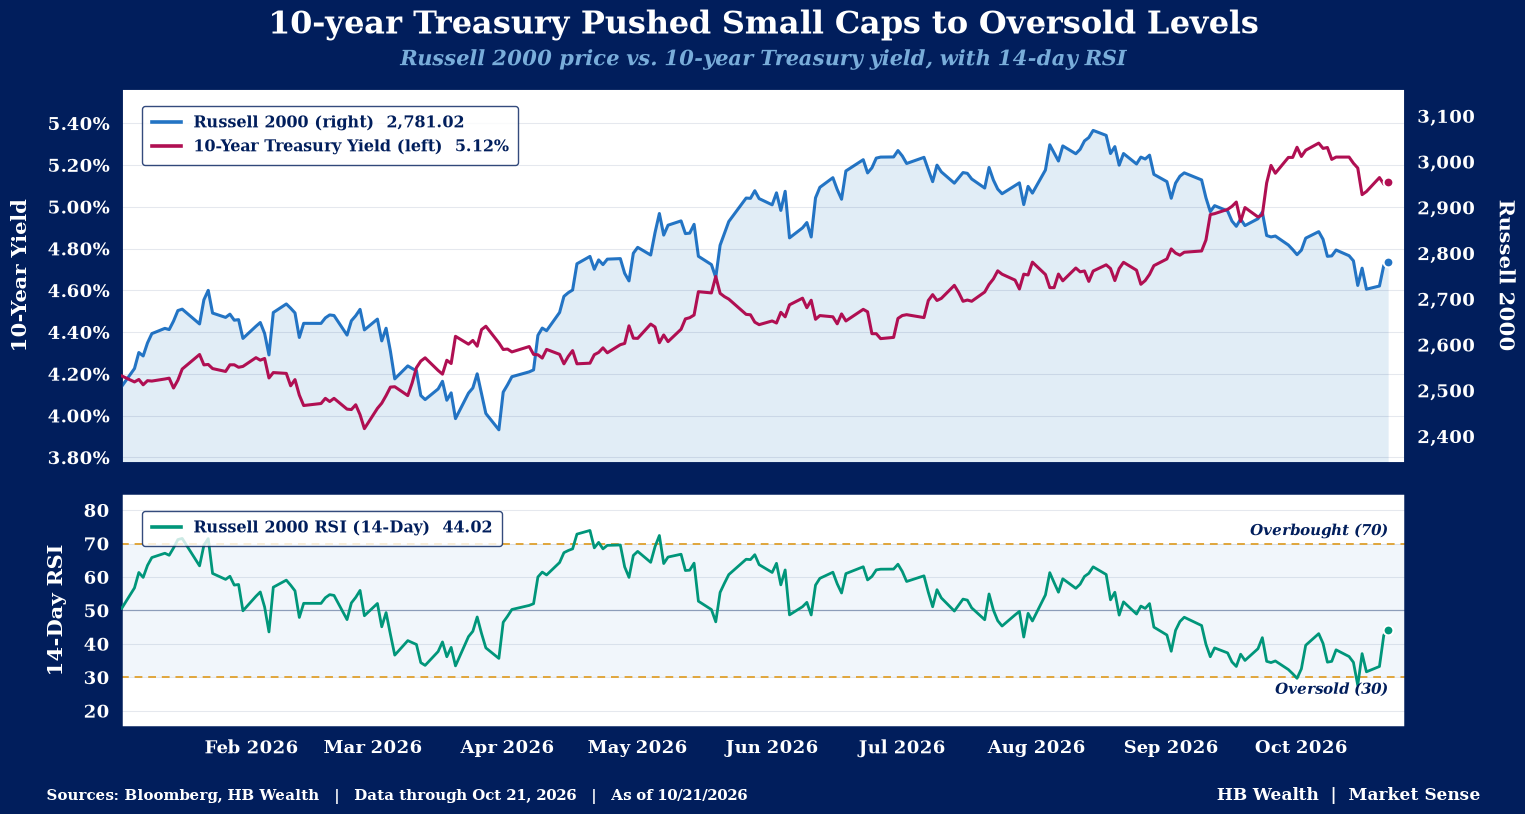
Small caps have been recovering as bond yields stabilized so far this month, and this is consistent with historical experience. The last time rates were a problem for the Russell 2000 was in 2022-23 when the 10-year surged from roughly 1.4% to nearly 5% keeping the small cap gauge in a bear market until just last year. During that stretch, several intra-cycle bond yield spikes – the initial move from December 2021-June 2022, from August-October 2022 and from April-October 2023 – caused the index to make or retest lows. However, each time, the Russell 2000’s 14-day RSI – a measure of sentiment – bottomed just below 30 as it just did amid the recent stabilization in yields. Thus, with sentiment this washed out already, a break from the torrid rise in yields could continue to drive better performance for small caps.
No Winners in the Small Cap Rout, but Beta and Leverage are Anchors
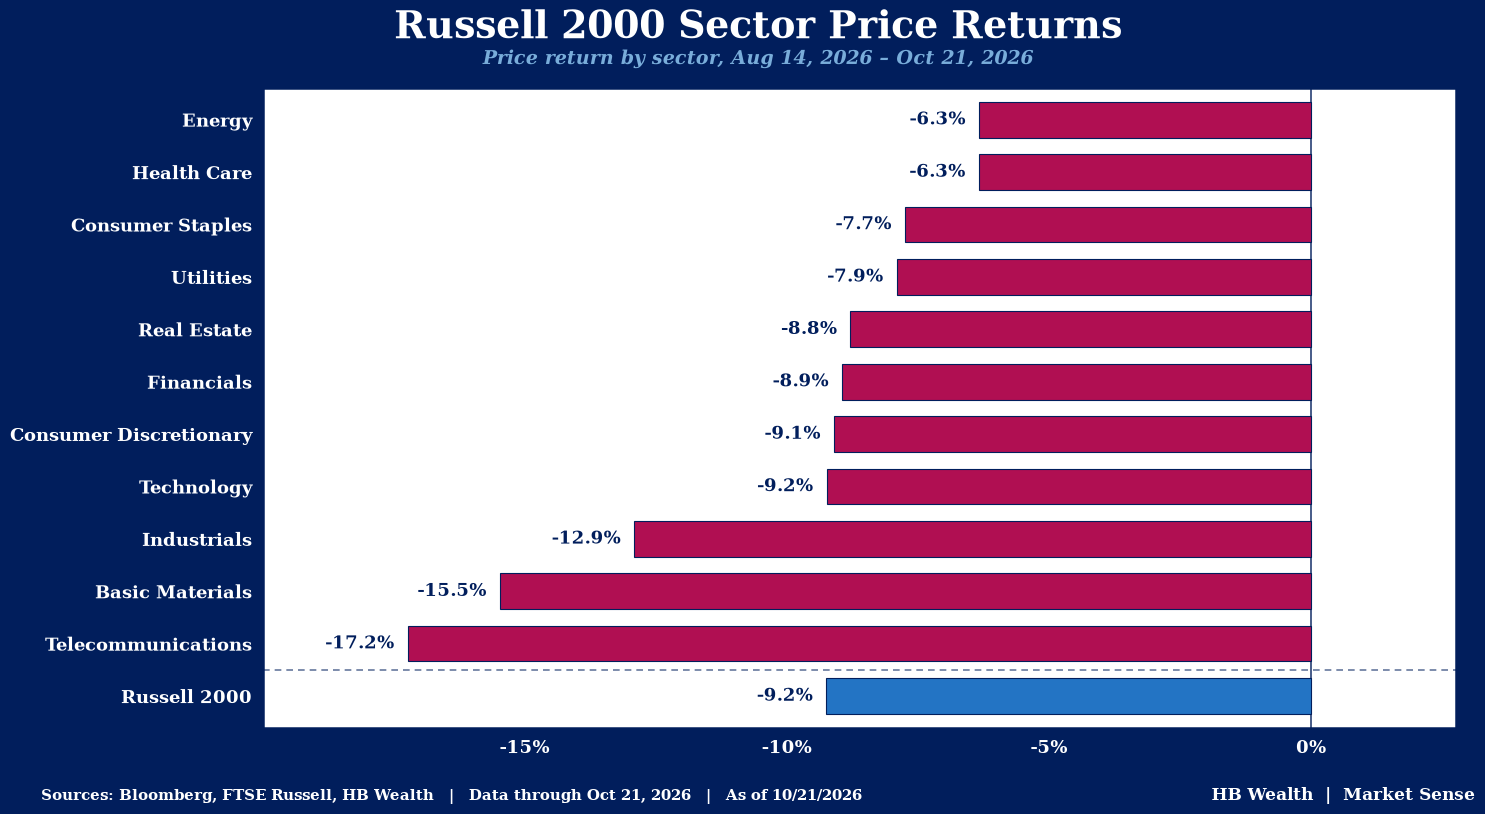
From styles to sectors to factors, nothing has escaped the fury of the correction in small caps – another sign that this correction is more about derisking portfolios amid a breathtaking move in yields than anything. Since the August high, Russell 2000 growth is down 11.8% while value is off 7.2%. Likewise, every sector is down over that time, led lower by telecom (down 17.2%), materials (down 15.5%), industrials (down 12.9%) and tech (down 9.2%). Health care (down 6.3%), energy (down 6.3%) and staples (down 7.7%) are conversely holding up the best.
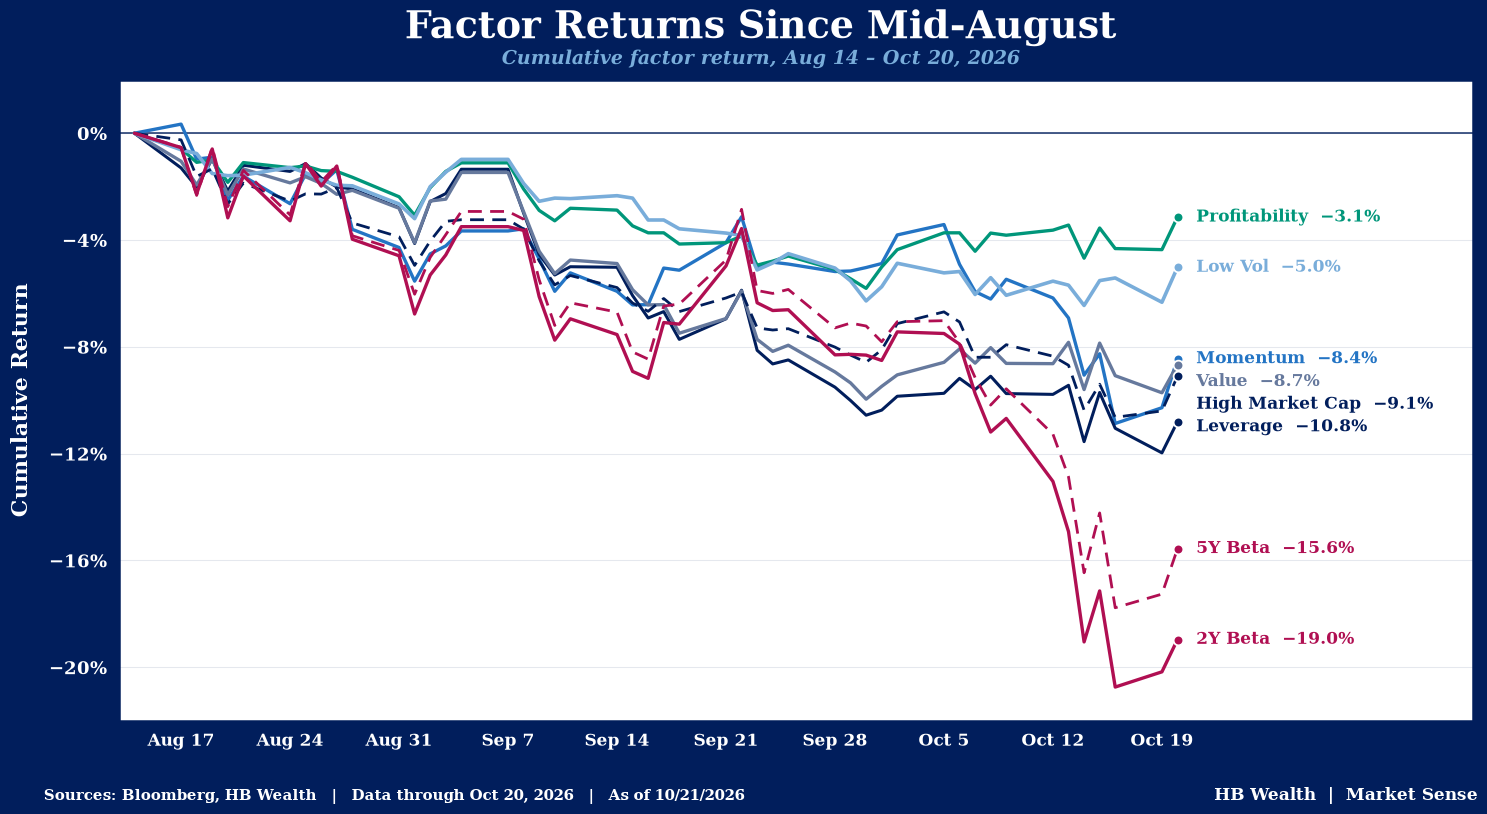
Each major factor category has also struggled since the mid-August high on a long-only basis, but beta – a measure of historical risk that illustrates how much a stock should move versus the market – struggled the most. Over that stretch, 2-year beta (down 20.2%) is the worst performing factor, followed by 5-year beta (down 17.6%). High leverage (down 12%), market cap (down 10.5%) and momentum (down 10.2%) have likewise struggled during the correction. The factor downdraft across large caps has been much less severe but the signal is similar – yield-driven weakness is the underbelly of the market. Both flavors of beta led Russell 1000 factors lower, down 13.2% and 11.9% across 2-year and 5-year lookbacks respectively, followed by high leverage (down 9.4%). In fact, this same pattern of factor performance emerged during the rate surge from December 2021-October 2023 – both versions of beta led the way lower, followed by leverage. In both 2022 and today, profitable stocks held up the best – offering some insight into what exposure might provide some shelter from the rout.
Profitable Stocks are Getting Thrown Out in the Bathwater
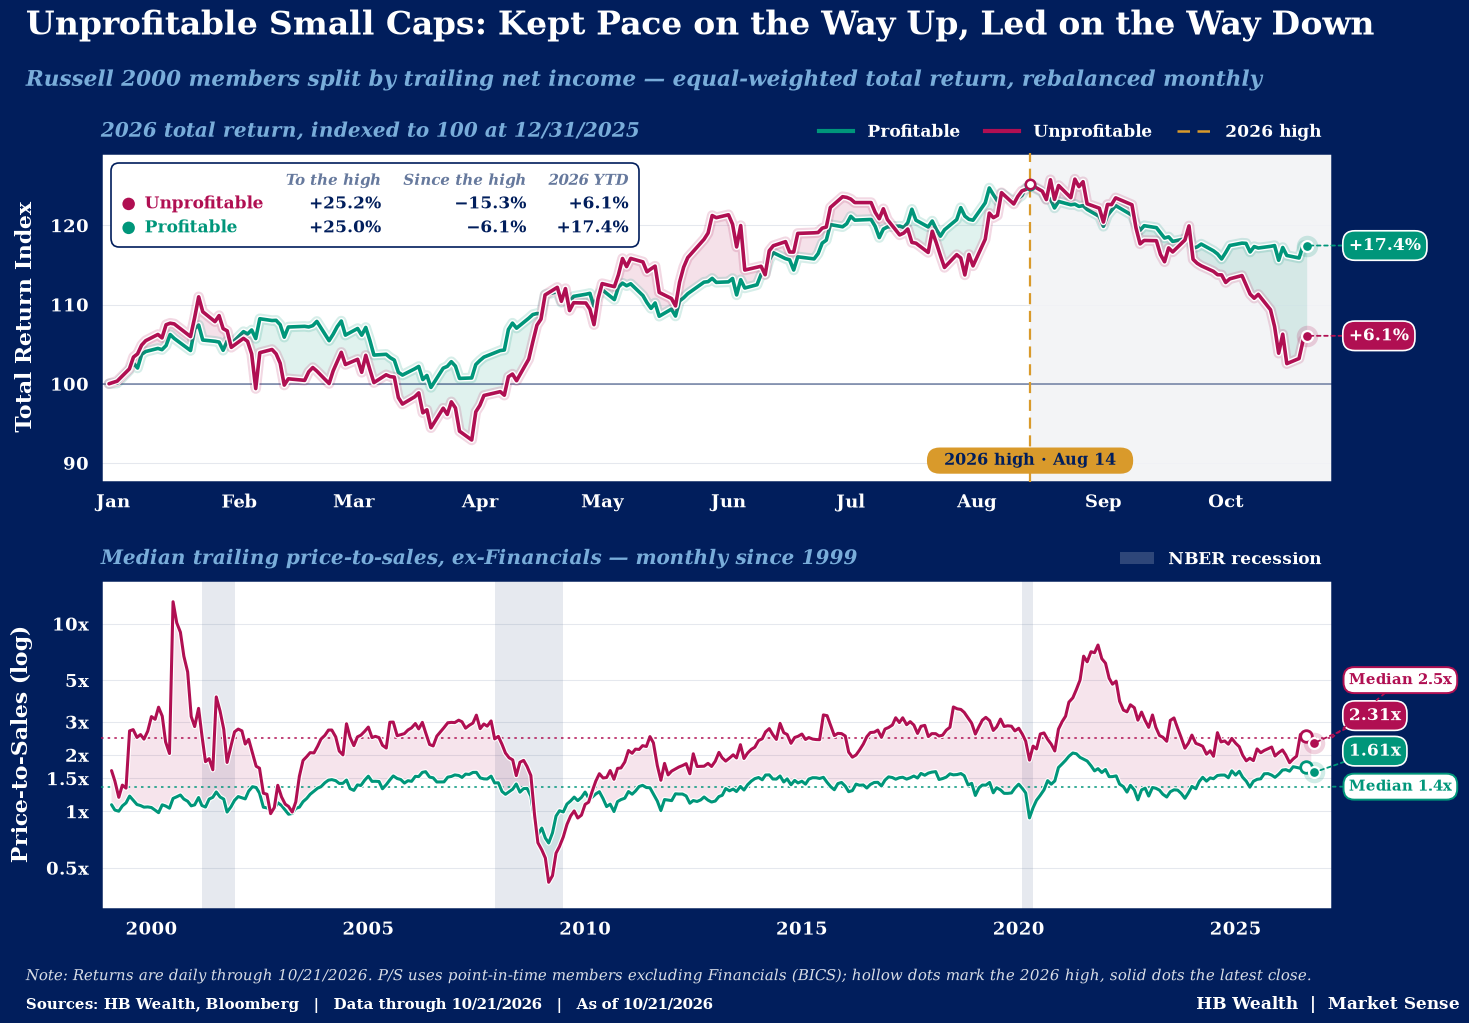
Unprofitable stocks drove a significant portion of this year’s small cap rally, but that trend has been reversing and may remain under pressure with rising yields. Through the mid-August high, unprofitable stocks were up 25.2% versus 25.0% for profitable small caps. Since then, the unprofitable cohort has slid 15.2% while profitable companies have fallen just 6.0%. Relative valuations for the companies in the red had risen versus those in the black, peaking at 1.5x the multiple of the profitable cohort but have normalized to 1.4x with the correction. The rising rate environment could make it difficult for unprofitable small caps to lead again – they led losses in 2022-23 as yields surged – but stabilization in yields could allow profitable small caps to at least regain their footing and power the small cap gauge higher given earnings and economic tailwinds that still persist. Of the 11 GICS sectors, health care, communications, and materials have the highest concentrations of unprofitable stocks while Utilities, financials, and discretionary have the highest percentage of profitable companies.
Where are The Opportunities Emerging? Stay Cheap and Profitable
Throughout the last several weeks’ downturn in small caps, topline forecasts have remained relatively robust, resulting in valuations for small cap stocks that are now 1.5 standard deviations below the average back to 2001 relative to the S&P 500 on a forward price/sales basis. Revenue estimates for the next three quarters have risen since July and on average, the Russell 2000 is expected to post 7.2% topline growth – nearly double the long run average since 2013 of 3.8%. Over that span, seven of 11 GICS sectors have faced revenue hikes on average to the next four quarters, led by energy, utilities, financials, real estate and tech.
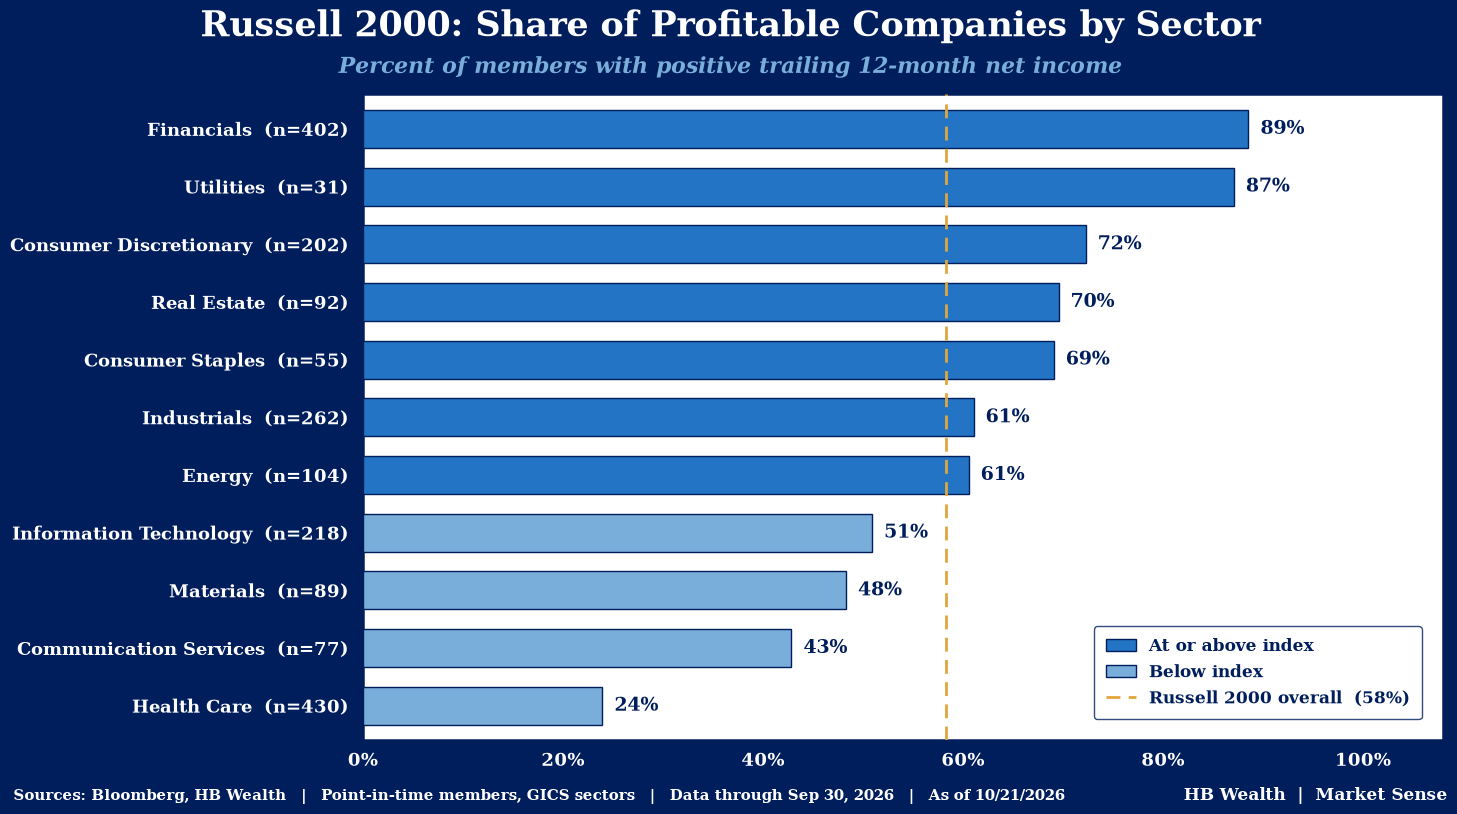
Given that rates are at the epicenter of the selloff, the intersection of revenue hikes, a heavy dose of profitable stocks and low multiples could uncover sector winners going forward. Currently, financials, utilities, discretionary, real estate, staples, industrials and energy have the largest share of companies that are profitable. Each of those groups trades close to recent 5-year averages on a forward EV/Sales or price/book (for financials and real estate) basis. Utilities, industrials and real estate are the cheapest currently, but utilities and real estate typically are some of the more rate sensitive groups.
Disclosure: HB Wealth is an SEC‑registered investment adviser. The information reflects the author’s views, opinions, and analyses as the publication date. The information is provided for informational purposes only and does not constitute an offer to sell or a solicitation of an offer to buy any investment product. This information contains forward-looking statements, predictions, and forecasts (“forward-looking statements”) concerning the belief and opinions in respect to the future. Forward-looking statements involve risks and uncertainties, and undue reliance should not be placed on them. There can be no assurance that forward-looking statements will prove to be accurate, and actual results and future events could differ materially from those anticipated in such statements. The information does not represent legal, tax, accounting, or investment advice; recipients should consult their respective advisors regarding such matters. Certain information herein is based on third-party sources believed to be reliable, but which have not been independently verified. Past performance is not a guarantee or indicator of future results; inherent in any investment is the risk of loss.