








Abstract:
- Russell 3000 growth just posted its worst nine-month stretch relative to value since the unwinding of the dot-com bubble.
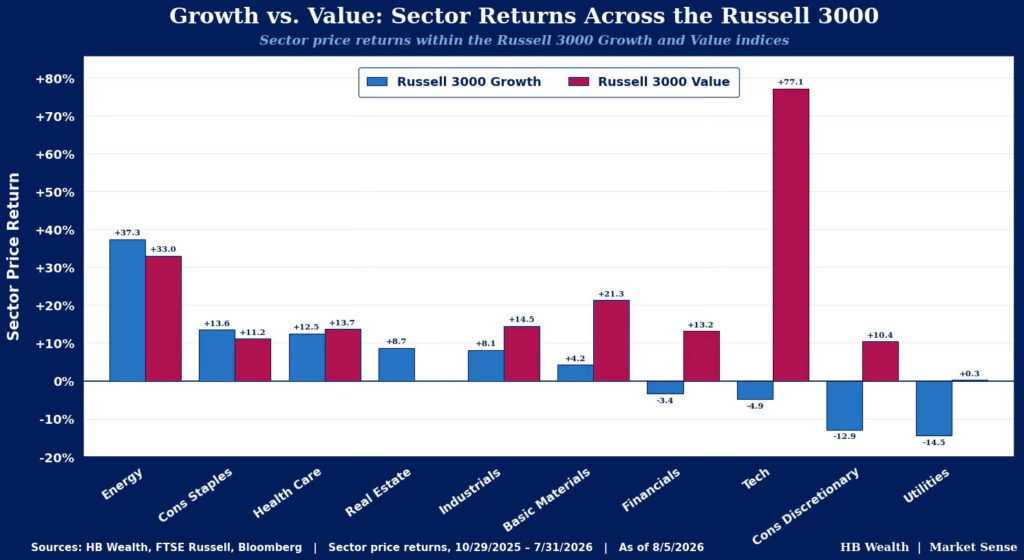
- It’s not just tech’s stumble driving underperformance, seven of nine sectors lagged value counterparts over that span and value-oriented tech stocks rose nearly 80%.
- There are four primary issues to watch for a continuation of the style rotation:
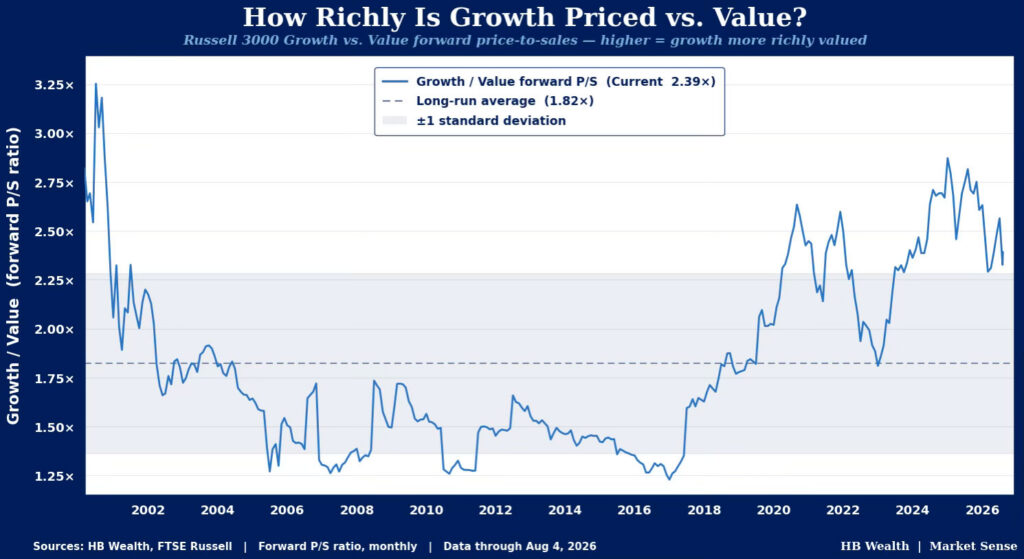
- Growth’s valuations will likely have to normalize for the style to find its footing again amid a clear penchant for cheaper shares. Multiples relative to value have dropped from last year’s extreme but remain 1.1 standard deviations above long-term average.
- Economic reacceleration has likewise been at the value style’s back all year long and could remain a catalyst for the style. Watch ISM and the yield curve for signals.
- Russell’s growth style was put at a disadvantage with index reconstitution in June. That pushed some high-flyers out of value and into growth just as price was peaking. Stabilization in this group will be key to enabling better performance.
- Growth has significant factor exposures to high volatility, high momentum and large size. These factors will help determine the style’s future – the first two greatly contributed to the July slump and size has been a drag most the year.
July was the worst calendar month for Russell 3000 growth relative to its value peer since 2001, and extends a streak favoring value that began last year. From its peak on October 29, 2025, through the end of July 2026, Russell 3000 growth is down roughly 3% while value has surged more than 23%. That underperformance for the style is the worst nine-month stretch beside the dot-com bubble unwind in 2000-2001. Over that same stretch, seven of the nine sectors represented in the Russell 3000 value index have outperformed growth counterparts, led by none other than tech (up 77.1%). These sharp divergences hint that the rotation out of growth toward value is more than a large sector weighting hitting turbulence – it is a newfound investor preference for cheaper stocks amid economic recovery as AI gains begin to spread beyond a select group of companies to the broader market.
Growth Valuations Might Have to Normalize for Style to Recover
Relative valuations may likely need to normalize even more before growth’s performance can stabilize. That October 2025 performance peak nearly neatly coincided with relative forward price/sales multiples approaching their 2024 zenith. Likewise, absolute multiples (at 5.4x forward sales) were notably worrisome, eclipsing even the roughly 4x that growth commanded at the March 2000 high. After the last nine months, growth now trades at 5.1x to value’s 2.2x (an all time high for value). This is still a 135% premium and 1.1 standard deviations above the norm to 2000. If the style is to push its way back to an average premium, growth’s multiple would have to fall by 2.3 turns or value’s rise by another 1.8 turns.
Economic Recovery is Aiding Value Stocks
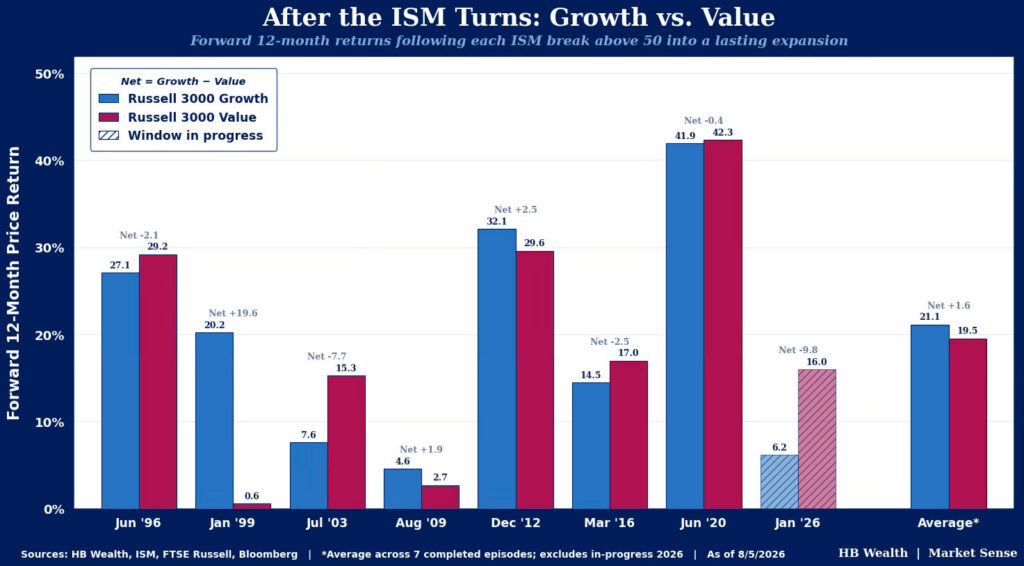
The economy also supports the recovery in the value style and may need to turn over again before growth can sustainably stage a recovery to value stocks. Value stocks are often perceived as more economically sensitive given the benchmark is more evenly distributed across sectors and has a heaver tilt toward cyclicals. Thus, it is no surprise that the gauge is outperforming growth as signs emerge that the US economy is reaccelerating. At the start of this year, ISM Manufacturing PMI flipped to expansion and accelerated throughout the year – breaking a more than 3-year stretch where the gauge was signaling contraction in the manufacturing economy. While not a totally clean signal for value performance, lasting flips in the ISM signal to expansion back to the mid-1990s have helped value lead in five of the eight observations. Average growth versus value returns are close but removing the flip to expansion that occurred in the final throes of the dot-com bubble in 1999, value posted an average 259 bps lead over the remaining seven instances (up an average 21.7% in the following year versus 19.1% for growth).
The yield curve is another signal to watch for the growth-to-value rotation. While it hasn’t been supportive this year, relative growth versus value performance is roughly negative 0.5 correlated to the 10-year minus 2-year treasury curve. Typically, the yield curve steepens in anticipation of better economic growth prospects and inverts ahead of recession as investors chase the safety of longer duration bonds. Thus, a steeper yield curve has typically been a boon for value while narrowing spreads have typically supported growth.
The style signal from the yield curve can also be tied back to sector concentrations. As of the June 30th reconstitution, Russell 3000 growth had a 65.7% weight in tech versus 16.8% for the value index. Industrials (11.9%) and discretionary (10.3%) are the only other sectors with above a 10% weight in the growth gauge. Conversely, five sectors break that mark in the Russell 3000 value index – in addition to tech, financials (18.4%, the biggest weight), discretionary (14.8%), industrials (13%), and health care (12%) all meet that threshold. Yield curve steepening is typically a fundamental boost to financials, aiding value. Likewise, the more even dispersion of sector weightings within value make it more representative of the US economy than the heavily tech-concentrated growth.
Russell’s Reconstitution is a Structural Issue Facing Growth Currently
Value has also outperformed growth across capitalizations in S&P’s suite of indices but the rotation has been much less severe over the past nine months. Since October 29th, S&P 500 growth is up 7.1% to value’s 10.6% while S&P Composite 1500 growth has gained 7.9% to value’s 11.1%. In comparison, Russell 1000 growth has fallen 3.7% versus a 22.9% gain for value while small cap growth has risen 12.4% to value’s 24.2% — highlighting some of the overlapping struggle growth has had with capitalization.
This divergence between S&P growth style performance and Russell’s versions comes down to two things – construction and Russell’s reconstitution schedule. S&P uses three factors – sales growth, the rate of earnings change to price, and momentum – while the Russell uses sales per share growth and a medium-term EPS growth forecast. However, the biggest impact to the performance differential between the two indices has been reconstitution timing – Russell reconstitutes its style indices with the overall index with June the last event, while S&P does it annually in December. This has coincidentally resulted in the Russell’s growth indices nearly top-ticking many high-flying tech stocks that migrated into the style this summer. Micron is perhaps the poster child of this effect, for while the stock is up over 200% year to date, it’s down nearly 24% since the end of June (when it also switched from Russell value to growth).
In fact, a look at the factor exposures of the Russell 3000 growth index relative to its value peer shows that the former is much more exposed to high volatility, larger size and higher momentum than the latter. That has proved particularly important in July with those same factors generally struggling. Bloomberg’s momentum factor faced a severe crash that month, falling over 9% and while low volatility provided a modest (nearly 4%) boost on its own, it outperformed high volatility stocks by close to 16%. Size contributions were less pronounced for the month but larger cap stocks have been a drag all year.
Disclosure: HB Wealth is an SECregistered investment adviser. The information reflects the author’s views, opinions, and analyses as the publication date. The information is provided for informational purposes only and does not constitute an offer to sell or a solicitation of an offer to buy any investment product. This information contains forward-looking statements, predictions, and forecasts (“forward-looking statements”) concerning the belief and opinions in respect to the future. Forward-looking statements involve risks and uncertainties, and undue reliance should not be placed on them. There can be no assurance that forward-looking statements will prove to be accurate, and actual results and future events could differ materially from those anticipated in such statements. The information does not represent legal, tax, accounting, or investment advice; recipients should consult their respective advisors regarding such matters. Certain information herein is based on third-party sources believed to be reliable, but which have not been independently verified. Past performance is not a guarantee or indicator of future results; inherent in any investment is the risk of loss.