


War in the Middle East and closure of the Strait of Hormuz has resulted in the largest spike in commodity costs since the start of the Russia-Ukraine war in 2022. Though the 2022 experience does not offer a perfect benchmark for what to expect this time, there are similarities in market responses – the commodity price spike and initial equity market shrug happened in the early phases of 2022’s experience as well. While the U.S. economy managed to survive the 2022 struggle without a declaration of official recession, the experience gave markets a lesson in how supply-constrained inflation surges can create earnings recessions and may set a precedent for what to expect should commodity supplies remain constrained much longer in the Middle East.
2022 vs 2026: Similarities and Differences
Every supply shock has different consequences for markets, and outcomes can be highly contingent on the nature and extent of the shock at hand. Almost certainly, the outcome of the surprising surge in commodity prices on account of war in the Middle East in 2026 will not play out precisely like the Russia-Ukraine war did in 2022. There are arguably more economic and policy differences than there are similarities between the periods. The economy was in its early cycle recovery phase after the 2020 pandemic shutdown, and the Fed was tightening rates in 2022 after letting the economy run hot in the immediate post pandemic period. Job growth averaged 0.25% MoM that year, quite the contrast to the approximately 0% average growth of the last six months. Artificial intelligence was not yet a major driver of equities – Nvidia traded for less than $20 a share. However, there is one notable similarity – commodity costs. The last time broad commodity prices (represented by Bloomberg’s Commodity Index) accelerated to their current level was in 2022. In fact, because of the recent surge in precious metals prices, the broad index has reached a higher level this year than it did at its peak in 2022.
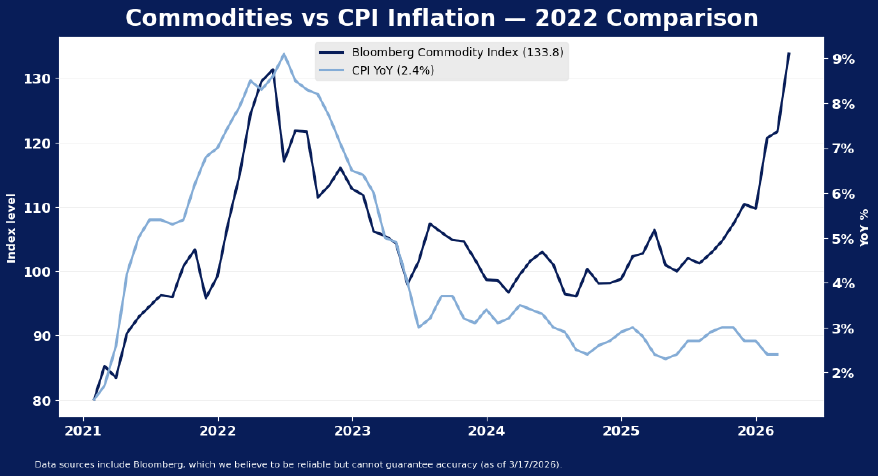
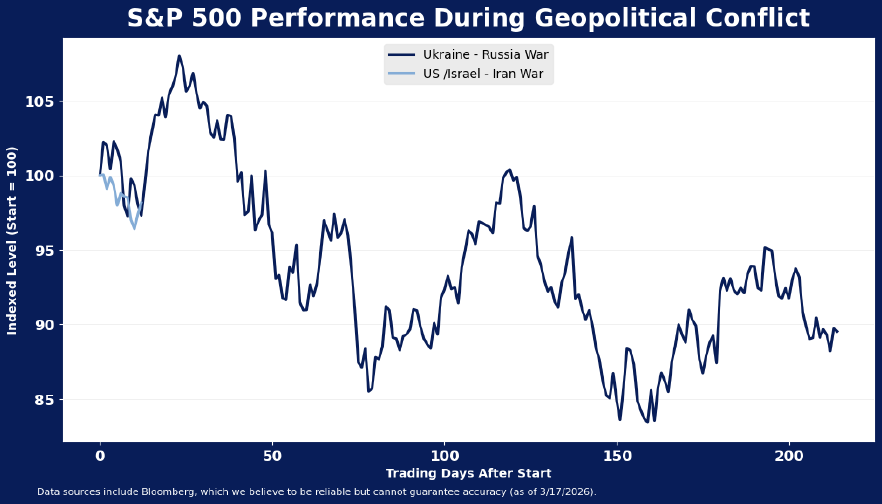
Back then, oil prices escalated to more than $100 per barrel just 4 days after Russia invaded Ukraine, held around that level or higher through July of that year, and global food costs surged with the disruption to Europe’s breadbasket. Stocks shrugged off the initial surge, assuming the war would be short lived. In the first two weeks of the Russia-Ukraine war, the S&P 500 dropped just 0.6%.
Inflation Pressure Resulted in Earnings Recession in 2022
But as the war dragged on (and pandemic shutdowns emerged in China, further exacerbating supply constraints), prices surged. Producer price growth escalated to a peak of 11.7% year-over-year in March 2022, and consumer prices followed, topping out at 9.1% growth that year. Notably, the economy weathered the storm reasonably well. GDP slowed from its rapid 2021 recovery pace as real personal consumption (PCE) was stopped in its tracks by the diversion of spending to necessities and away from discretionary items. Real PCE growth averaged just 0.14% per month in 2022, well beneath the average pace of 0.59% per month in 2021.
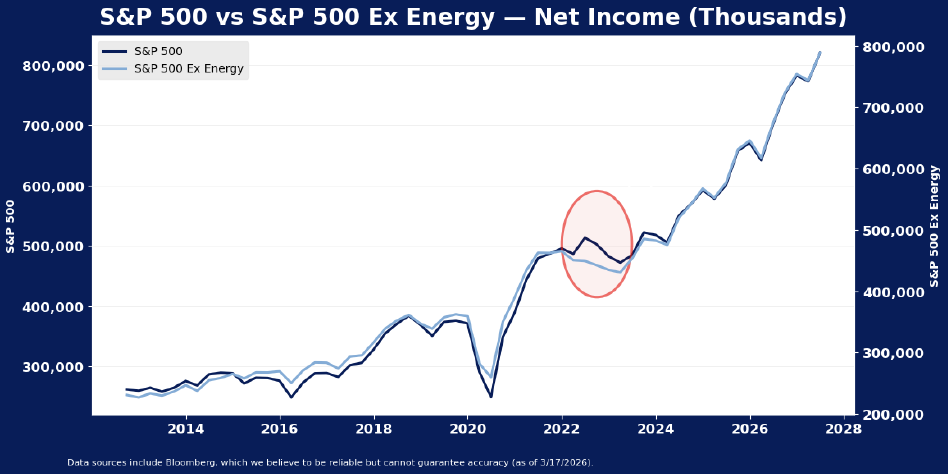
The effect of the price escalations was very clear in S&P 500 earnings, even if it was not clear in the economy at large. Energy sector earnings rose to new highs in 2022, reflecting the elevation in commodity costs, but the rest of the sectors suffered. Over five quarters of decline from the end of 2021 to early 2023, S&P 500 earnings excluding the energy sector dropped. Notably, despite evidence of slowdown in GDP growth as consumers retrenched somewhat, S&P 500 revenues held up, and continued to grow. But earnings declined as margins compressed due to commodity cost pressures.
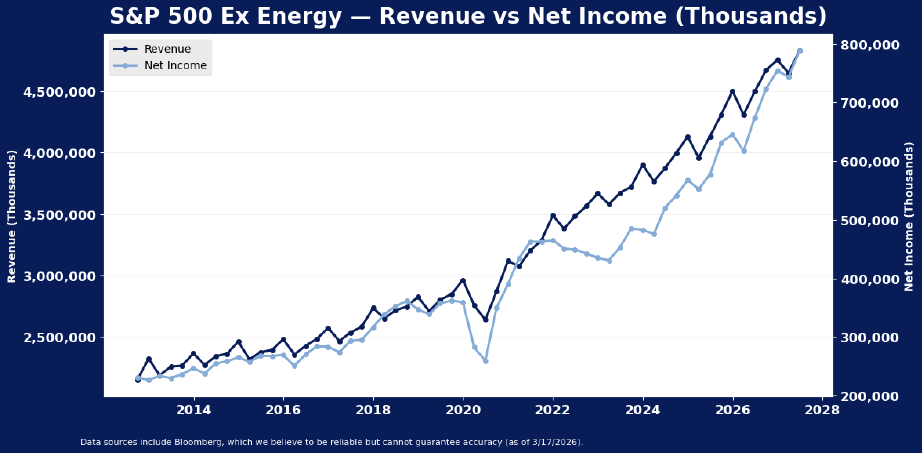
The What started as an earnings boost to the energy sector turned into a broader earnings recession for the other sectors in the index, as input costs rose quickly and compressed margins. Initially, earnings growth estimates rose, and indeed, energy sector earnings accelerated to help drive index earnings higher in the first quarter of the commodity cost spike. But ultimately, higher prices weighed on earnings for non-energy S&P 500 sectors, and tipped the index at large into an earnings recession.
Conclusion: The Clock is Ticking
There is no certainty that commodity costs will stay high as long as they did in 2022, and certainly the stage of economic conditions is different in 2026 than it was in 2022. Nonetheless, commodity prices are already matching levels touched during the inflationary surge in 2022, and present considerable risk to earnings if they do not cool in short order. Markets have greeted the crisis with relative calm, just as they did early in 2022. That year, it took 2 months of elevated commodity prices to dismantle the equity market’s sanguine view, and 5 months of elevated oil prices to create a recession in earnings. At just two weeks in, there is still time for resolution, but the clock is ticking. The longer the war in the Middle East extends, the more likely it becomes that a 2022-style earnings challenge emerges in 2026.
Disclosure: HB Wealth is an SEC-registered investment adviser. The information reflects the author’s views, opinions, and analyses as the publication date. The information is provided for informational purposes only and does not constitute an offer to sell or a solicitation of an offer to buy any investment product. This information contains forward-looking statements, predictions, and forecasts (“forward-looking statements”) concerning the belief and opinions in respect to the future. Forward-looking statements involve risks and uncertainties, and undue reliance should not be placed on them. There can be no assurance that forward-looking statements will prove to be accurate, and actual results and future events could differ materially from those anticipated in such statements. The information does not represent legal, tax, accounting, or investment advice; recipients should consult their respective advisors regarding such matters. Certain information herein is based on third-party sources believed to be reliable, but which have not been independently verified. Past performance is not a guarantee or indicator of future results; inherent in any investment is the risk of loss.

