Abstract:
- SpaceX broke the record for the largest IPO on record on June 12th with average performance on its first day of trading. Other giant IPOs from OpenAI and Anthropic are likely to follow in the second half of the year.
- Going back to 1980, new issues have struggled in the year after going public. Performance has been particularly bad in the post-pandemic era.
- Larger-cap issues tend to fare better than smaller companies. Nonetheless each size cohort tended to underperform similar size peers.
- Profitable IPOs significantly outperform their unprofitable brethren, and that factor might continue to separate the wheat from the chaff across 2026’s IPO class.
- Fast track index inclusion may mitigate the downside for new IPOs given the embedded bid from passive funds (as we detailed in our note here). Since none of 2026’s giants are expected to be profitable for some time, they will not be included in the S&P 500. They will nonetheless be fast-tracked into other popular benchmarks.
SpaceX kicked off what is likely to be a wave of historically large IPOs with its debut on the U.S. market last week. The stock surged 19.2% on its first day of trading, right on the average first-day pop of 19% for IPOs since 1980. New offerings of equities historically have struggled to perform in the year after the first day gain and have suffered more than usual in the post pandemic era. Size helps – large cap issues tend to perform better than small – but even large cap IPOs historically underperform peer groups. Profitability appears to be the bigger factor for IPO performance. Over time, profitable IPOs significantly outperform unprofitable IPOs. All three of 2026’s highly anticipated giant IPOs, which include SpaceX as well as the confidentially-filed OpenAI and Anthropic, lack profitability.
While history suggests this lack of profitability may inhibit 2026’s IPO class performance, some index providers such as Russell, MSCI and Nasdaq have agreed to relax index inclusion rules for SpaceX, setting a precedent for the others and potentially mitigating downside risk for the new issues. The stocks will not receive a ticket onto the S&P 500’s bullet train due to their lack of profitability, but fast track into other benchmarks is likely to result in passive investor demand that would otherwise have been absent from the scene.
IPO Performance has Been Particularly Poor Since Pandemic
IPOs historically underperform similar non-IPO stocks in their first year of issuance, but the struggle has been particularly persistent and severe in recent years. On average, stock prices of IPOs from 1980-2024 “popped” 19% on their first day, and rose 5.6% over the subsequent 12 months. Over the same window, the broad market (represented by the Russell 3000) returned an average annual 11.5% and comparable size-matched firms returned roughly 11%, so IPOs underperformed both the market and similar non-IPO stocks by several percentage points in their first year, historically.
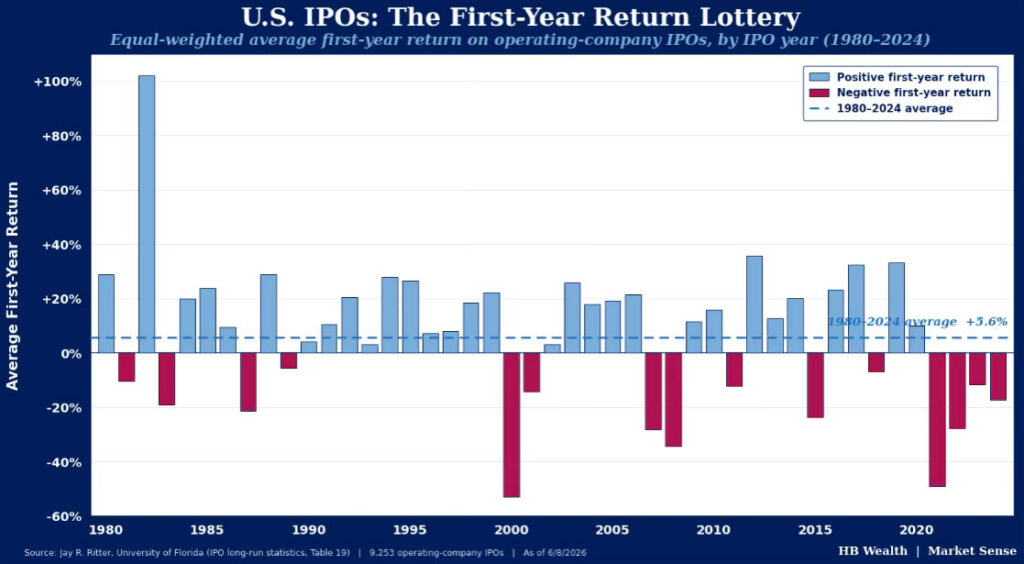
However, performance varies significantly by year, and even by decade. IPO performance was strong in the mid-1980s and 1990s, and in most years during those decades, stocks on average rose in the year after their first day of trading on the public equity market. Performance since the tech bubble burst has been more inconsistent, and particularly poor as of late. Periods of market stress such as the 2000 dot-com peak and the 2008 Great Financial Crisis accompanied significant declines in IPO share prices in their first year. The 2021–2024 stretch following the SPAC-dominated IPO glut just after the pandemic has been particularly poor. IPOs on average posted negative performance every year since 2021 in the worst stretch on record for new issue performance. Treating all 475 IPOs from 2021–2024 as one group (weighting each year by its IPO count), the average one-year return was about -38%. The 2021 cohort dominates that number because it had 311 of the 475 issues and returned -49%. Yet, even if each cohort year is equally weighted, the average return is still about -26%. Over the period, the IPO group underperformed the broad market by an average 66% and underperformed the comparable size-matched firms by an average 52% on a simple average 3-year basis.
Large IPOs Perform Better, But Profitable Companies Perform Best
History shows bigger IPOs have had slightly better returns, but even the largest IPOs tend to underperform the market at large. Returns improve almost monotonically with company size over a longer-term timeframe. On average since 1980, the smallest issuers (under $10M in pre-IPO sales) fell outright over three years and trailed the broad market by more than 50 percentage points. Measured against size-and-value-matched peers, the smallest issuers (less than $100 million) underperform matched peers most, by about 34 percentage points over their first three years public, with an average stock price drop of about 18%.
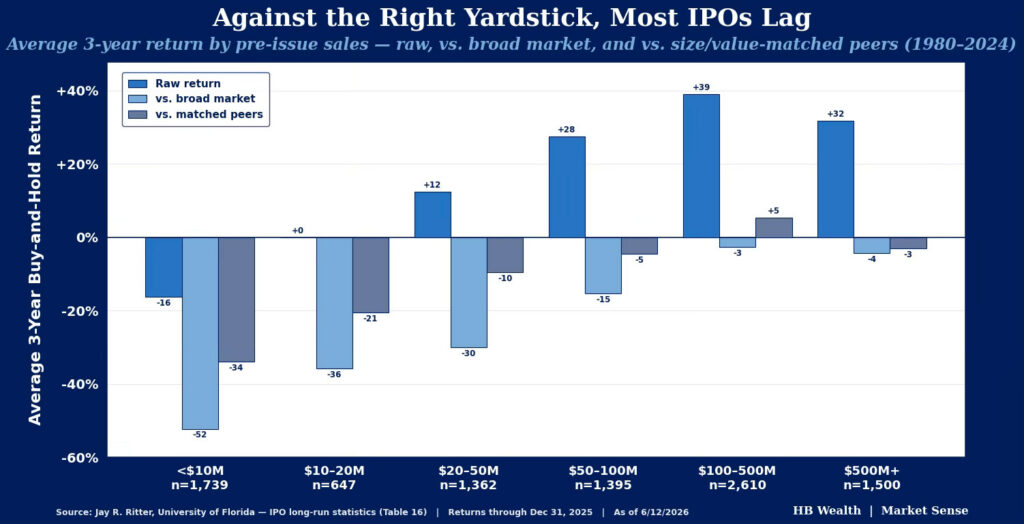
The performance of large caps is nothing to brag about, but is at least better than small caps, on average. The largest issuers only underperformed by a few percentage points, nearly matching the return for the market at large. The $100M+ group of IPOs posted an average, 2.3% 3-year return over peers. This is because the very largest bucket ($500M+) return was −3.0%. Only the $100–500M band clearly beat the public peer group (+5.4%) on average since 1980.
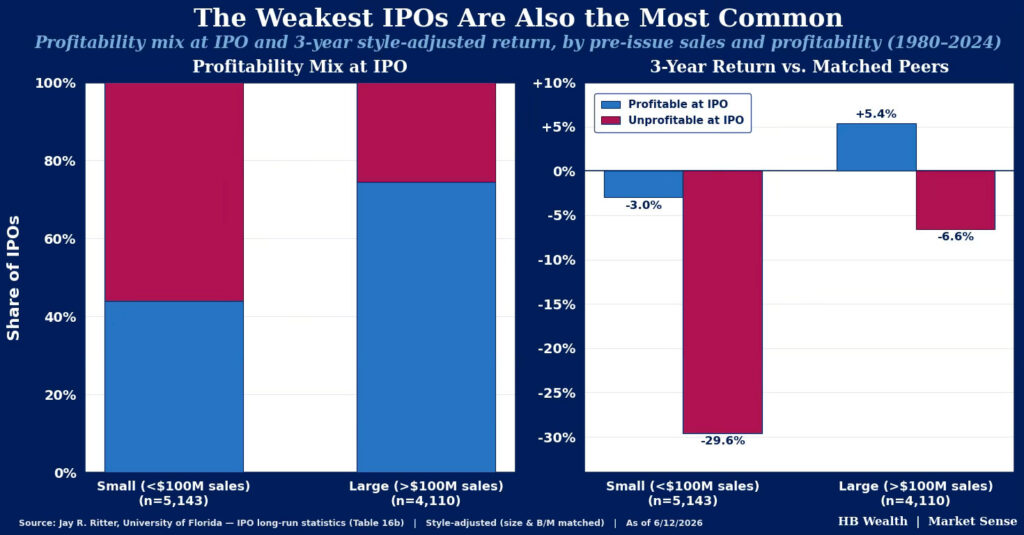
The size performance differential is made particularly clear by the profitability profile of IPOs. The most profitable IPOs perform best, regardless of size, and most large IPOs are from profitable companies, historically. While more than half of IPOs for companies with less than $100 million in sales are unprofitable, only about a quarter of larger company IPOs (> $100 million in sales) are unprofitable. Three-year average returns are extremely poor for unprofitable smaller companies in particular, but three-year average returns are also poor for unprofitable larger companies, and on average, only profitable IPOs produce positive returns.
As we detailed in our deep dive in mid-May (here), 2026’s IPO class has a few unique characteristics, not least of which is the fact that the year will certainly be the strongest on record for IPO size, with SpaceX now trading and OpenAI and Anthropic still likely to issue shares. These three giants are currently unprofitable, and all also project they will remain unprofitable for some time, with spending expected to outpace revenue growth for years in all cases. History suggests this lack of profitability will likely weigh on share prices.
However, the willingness of benchmark providers to bend rules for inclusion in popular indexes could help support performance, potentially offsetting this profitability constraint. Russell, Nasdaq and MSCI have all agreed to fast track SpaceX for inclusion in their benchmarks within 15 days. This means all ETFs benchmarked to these indices will be purchasing shares. While Dow Jones/S&P has held firm to profitability requirements for benchmark inclusion, implying it will be at least a year of trading before the new issues join the S&P 500, these stocks’ quick entry into other benchmarks (combined with strong investor interest in technology themes in general) may help offset some of the historical precedent for poor performance of unprofitable IPOs.
Disclosure: HB Wealth is an SECregistered investment adviser. The information reflects the author’s views, opinions, and analyses as the publication date. The information is provided for informational purposes only and does not constitute an offer to sell or a solicitation of an offer to buy any investment product. This information contains forward-looking statements, predictions, and forecasts (“forward-looking statements”) concerning the belief and opinions in respect to the future. Forward-looking statements involve risks and uncertainties, and undue reliance should not be placed on them. There can be no assurance that forward-looking statements will prove to be accurate, and actual results and future events could differ materially from those anticipated in such statements. The information does not represent legal, tax, accounting, or investment advice; recipients should consult their respective advisors regarding such matters. Certain information herein is based on third-party sources believed to be reliable, but which have not been independently verified. Past performance is not a guarantee or indicator of future results; inherent in any investment is the risk of loss.