Abstract:
- Even thought he parabolic move in AI-related large cap stocks is worrying, the rapid improvement in undervalued stocks could help sustain the bull trend for the market at large.
- Tech has driven a sizable portion of large cap returns but even without it, the index still would have doubled the typical two-month return since the March low. All small-cap sectors are up since the nadir and price breadth is broadening.
- Sector and size valuation discounts account for some of the widening bull run as several economic cues support greater participation in the rally.
- Consensus earnings trends likewise show a stronger backdrop. The 493 is expected to pull ahead of mag-7 earnings growth in 2H and their revisions have lapped the mega-cap cohort recently. Small caps are likewise enjoying a tailwind from estimate revisions.
The undercurrents of the equity market are worth paying attention to, for while parabolic moves in groups like semiconductors threaten to come back to bite large cap stocks, this short run concern may be somewhat offset by a quieter, but significant improvement in undervalued stocks, sustaining the bull trend for the market at large. The U.S. equity market’s rally since the March low has been led by tech, but it is a mistake to suggest the gain is too narrow to sustain, for participation has been reasonably broad, and included a remarkable surge across non-tech sectors and among smaller cap stocks. As small caps and the equal weighted large cap index remain significantly discounted to mega-cap brethren and supported by improving domestic economic conditions, there remains scope for continued improvement in these under-owned and undervalued segments of the U.S. equity market.
Even Ex-Tech, Large and Small Caps Have Posted Strong Gains
We’ve written about the spectacular move in semiconductor stocks since the low in March as a potential risk to the market in the near term, given the AI-related surge drove the bulk of the market gain over the period (here). However, it would be a mistake to suggest this was the only thing that drove the equity market recovery in the last few months. Since the March 30th low, the Bloomberg 500 large cap index is up 20.4%. While tech has led that gain and driven more than its fair share of it at 15.3 percentage points of the rise, it is misleading to suggest this was the only thing going for stocks. Six other sectors also posted gains of at least 4.8%, and only three sectors (energy, staples and utilities) dropped over that frame. The large cap gauge is up 13.6% on an equal weighted basis since the March low, also confirming that more than just mega-cap tech is fueling the rally. Even excluding tech and communications – which added 2.1 another percentage points to stocks’ recent surge – the index would be up 3.2% since March 30. This is roughly double the average rolling 1.6% two-month gain going back to 1993.
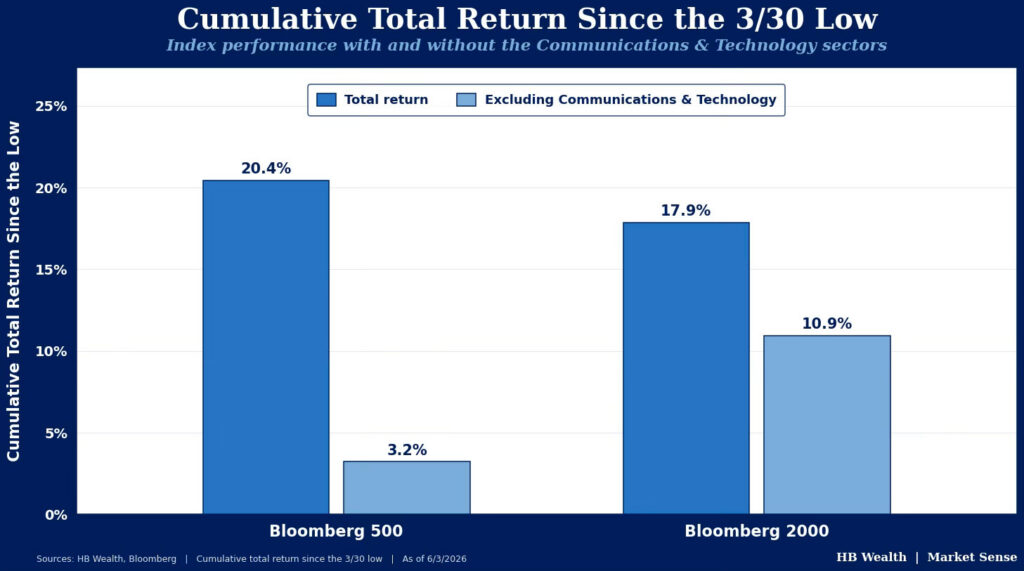
Likewise, the suggestion that tech is responsible for the equity rally ignores a nearly equally impressive run from more economically sensitive small cap stocks. The Bloomberg 2000 small cap index is up 17.9% since March 30th. Notably unlike its large cap peer, tech (11.5% of the index) is merely the fourth largest sector in small caps, barely edging out discretionary (11.0%), and behind financials (19.2%), health care (17.8%), and industrials (15.1%). While small cap tech’s 54.3% rise since the low is even more impressive than its large cap peer (up 48.0%), so is its supporting cast. Every small cap sector is up over that time with nine of eleven up more than 8%. In fact, excluding tech’s 6.1 percentage point contribution to the since March 30th gain, the Bloomberg 2000 would still be up 10.9%. This is extremely strong performance compared to the average rolling two-month gain for the index of 1.8% since 1993.
In sum, the recent market rally has been led by tech, but that doesn’t mean it has only been about tech. Traditional technical measures of breadth confirm the rally is not as broad as usual when stocks are making new highs, but more than half of stocks are rising, and most of those are rising at an above average pace. The percentage of Bloomberg 500 and Bloomberg 2000 members trading above their 200-day moving averages (at 53.1% and 59.1%, respectively) is nonetheless still north of the 50%, confirming most stocks are still participating in the market gains.
Valuations are Driving Return Differentials Under the Index Hood
At least some of the broad, relative sector underperformance between large and small caps can be chalked up to a preference for lower valuation equities playing out beneath the headline gains, and both earnings and economic trends suggest this valuation re-rating streak may continue to support equity markets.
While it’s not a clean linkage to outperformance since the March low, the wide swath of relative sector discounts across small caps has likely factored into the small cap group’s broad-based gains. Even though there’s some concern about absolute multiples, they remain below both the early 2026 and 2021 highs and provided domestic economic growth remains intact and the Fed is not forced to tighten policy materially, small caps’ discount may continue to spark outperformance over large cap peers.
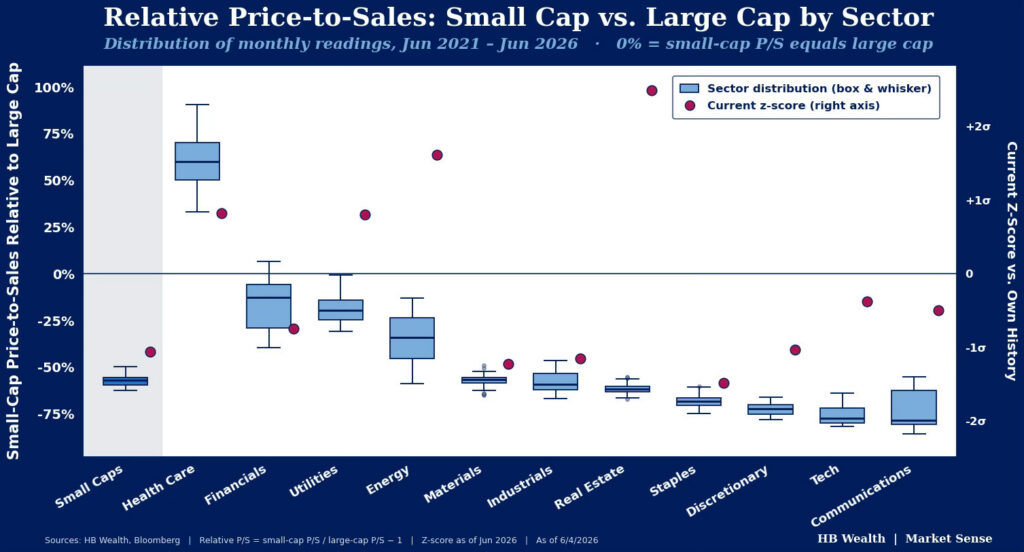
On a forward price/sales basis, the Bloomberg 2000 is 1.1 standard deviations cheap to the Bloomberg 500 versus the most recent 5-years. Calculating a relative multiple between small and large cap sector peers shows that small cap staples (1.5 deviations below), materials (1.2 deviations below), industrials (1.2 below) and discretionary (1 below) are the cheapest sectors relative to their respective large cap counterparts. Conversely, real estate (2.5 deviations above) is the most expensive, followed by energy (1.6), health care (0.8) and utilities (0.6).
Similar to the discount in small caps, the equal weighted version of the Bloomberg 500 is much cheaper than its cap-weighted counterpart. On a forward P/E basis, the equal weighted index trades at 18.7x – down from its recent high of 20.6x in 2024 and its post-great financial crisis apex of 25.7x in 2020 when easy money policy drove significant rerating across smaller capitalization stocks. Relative to the cap-weighted version, that puts the equal weighted gauge at a 12.9% discount which is good for 0.8 standard deviations below the recent 5-year norm.
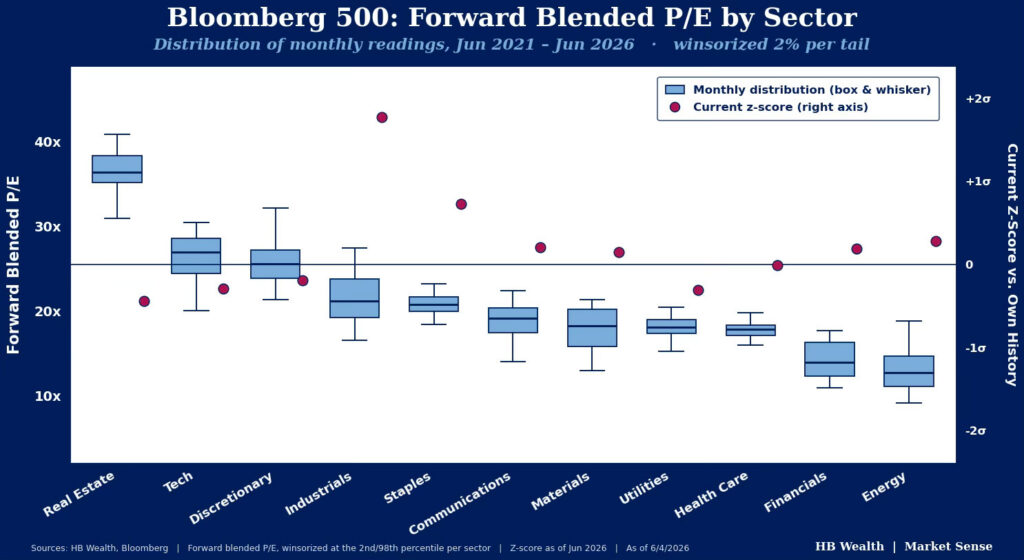
Notably, on a median basis, most sectors in the S&P 500 are currently either close to fairly valued relative to their five-year historical valuation levels, or slightly undervalued, even after the spring surge in stocks. Industrials and staples companies are the only groups trading at materially higher than average forward P/E multiples while utilities, discretionary and energy stocks are still trading at hefty discounts.
If the Economy Keeps Synching Up, It Will Continue to Support Smaller Stocks
There are signs that the economy is shifting from what can be best described as a disjointed, rolling recession to one where a wider swath of signals is pointing up, and this should continue to support performance for smaller capitalization stocks less dependent on the AI trade and more dependent on a general improvement in economic conditions.
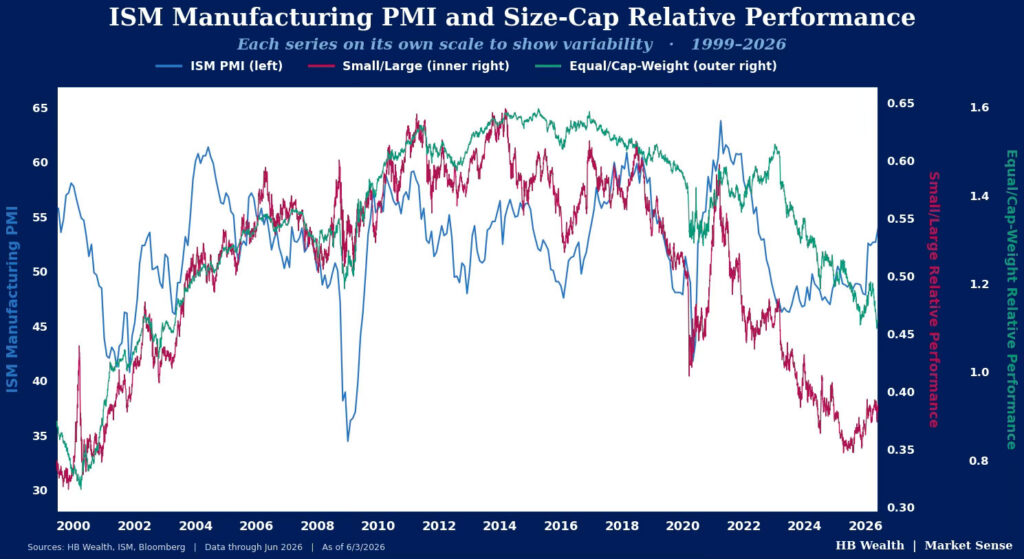
The most recent and perhaps most important signal for smaller stocks is the ISM Manufacturing PMI. That gauge returned to expansion in January, following contractionary readings for the better part of three years, and continued to hook higher over subsequent months, hitting its strongest level since May 2022. Historically, when the gauge has flipped from contraction to a lasting expansion, it has supported both small cap and large cap equal weighted outperformance, with the Bloomberg 2000 leading the Bloomberg 500 by an average 7.8% and equal weighted stocks outperforming the cap-weighted gauge by 4.8% in the 12 months after the indicator toggled from contraction into positive territory.
Other signals from the bond market similarly make a strong case for small caps and equal weighted gauges. The 10-year minus 3-month Treasury yield curve, which is the Fed’s preferred version for assessing recession risk, has been steadily steepening as growth and inflation prospects rise together. Back to 2009, the relative performance of small caps versus large caps has been 0.74 correlated to that curve as typically a steeper curve reflects investor expectations for a strengthening economic backdrop. Similarly, the curve has been 0.58 correlated to equal weighted large cap relative performance. High yield option-adjusted spreads (OAS) at near all-time lows also supports small cap performance. Typically, smaller companies tap high yield markets for debt funding and spreads tend to blow out in times of stress and narrow when things are good.
Estimates are Strong, But Ex-Mag-7 Is Likely to Lap the Field
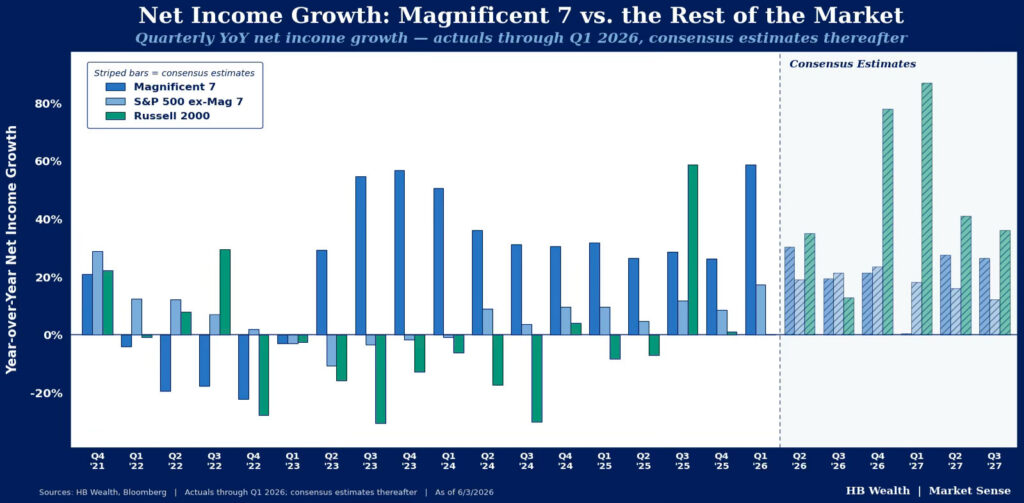
Fundamental growth forecasts likewise support equal weighted and smaller stock outperformance. Over the past three months, S&P 500 earnings estimates for the next four quarters have risen by an average 266 bps. However, on a current constituent basis, the index excluding the Magnificent-7 is expected to post faster growth than the gauge at large starting in 3Q26 and estimates have risen by nearly double the pace of the full index, up 482 bps over the same time frame. Likewise, Russell 2000 topline forecasts have climbed by 61 bps over the past three months but excluding tech, forecasts have risen 72 bps. This stronger growth and improving momentum suggests a broad-based fundamental advance is now expected to emerge across capitalizations, reflecting the general improvement in economic conditions. As long as the Fed doesn’t have to slow the economy down too much with rate hikes, the fundamental outlook appears to be signaling a strengthening backdrop for smaller cap stocks.
Disclosure: HB Wealth is an SECregistered investment adviser. The information reflects the author’s views, opinions, and analyses as the publication date. The information is provided for informational purposes only and does not constitute an offer to sell or a solicitation of an offer to buy any investment product. This information contains forward-looking statements, predictions, and forecasts (“forward-looking statements”) concerning the belief and opinions in respect to the future. Forward-looking statements involve risks and uncertainties, and undue reliance should not be placed on them. There can be no assurance that forward-looking statements will prove to be accurate, and actual results and future events could differ materially from those anticipated in such statements. The information does not represent legal, tax, accounting, or investment advice; recipients should consult their respective advisors regarding such matters. Certain information herein is based on third-party sources believed to be reliable, but which have not been independently verified. Past performance is not a guarantee or indicator of future results; inherent in any investment is the risk of loss.