








Abstract:
- Rising government debt, bond yields and term premiums in developed markets contrast with relatively stable conditions in emerging markets. By one measure, it is now cheaper for emerging market governments as a group to borrow funds for 10-years than it is for developed markets.
- The last several years of repricing in global bond markets has been much tougher on developed markets than emerging. Now 13 of the 20 developed markets we track have 10-year yields at or near 10-year highs, and 4 are at or near 20-year highs. In contrast, not one of the emerging market countries that we track have 10-year debt yields at or near 10-year highs.
- Much of the increase in yields in developed countries may be related to increasing nominal growth prospects. However, growth is rising faster in emerging markets. Debt to GDP ratios in developed countries are meanwhile higher than in emerging countries, and fiscal imbalances may be starting to weigh.
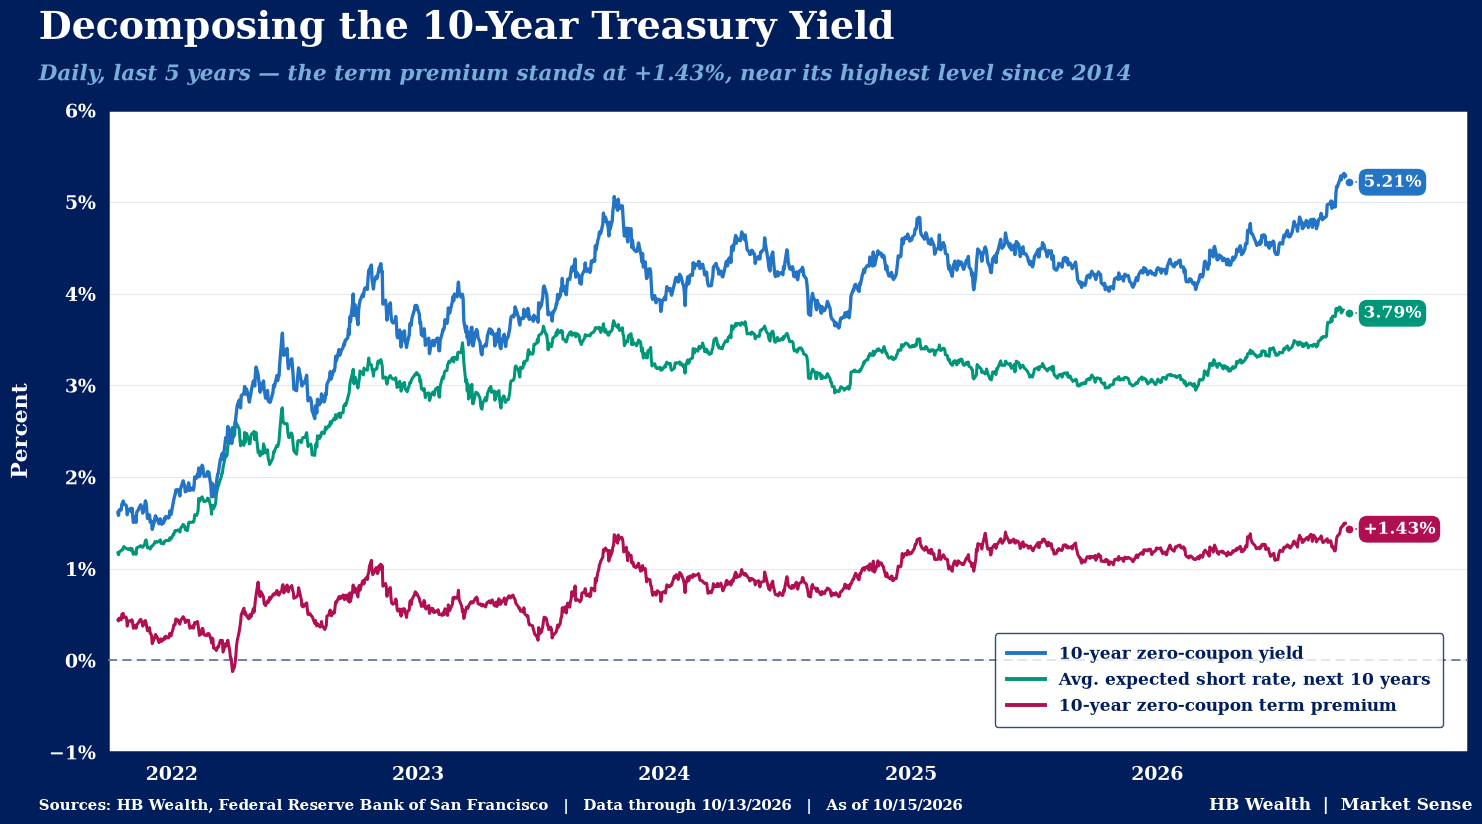
- Higher borrowing costs in highly indebted countries can become a risk to growth when yields rise when investors demand a higher “term premium” to compensate for swelling debt and fiscal deficits. The term premium has accounted for about 1/3 of the rise in yields in the U.S. over the past year, and is rising relatively quickly in most developed markets.
Most global bond markets have struggled somewhat as of late, but the move has been less broad in emerging markets relative to developed markets. Over the last year, 11 of the 15 emerging markets we track showed an increase in 10-year yield, while all 20 developed markets saw 10-year yields rise. Indeed, the last several years of repricing in global bond markets has been heavily centered on developed markets, and not just because developed market 10-year yields were near zero in the pandemic and have repriced rapidly over the last five years.
Some emerging market bonds have shown weaknesses over the last year as well, but broadly, emerging markets appear to be in a remarkably steady state by comparison to developed market counterparts. Ten years ago, emerging market 10-year debt yielded 6-7%, depending on weighting methodology. Emerging market 10-year yields fell to a low of 3-4% in the pandemic and have since been relatively stable by comparison to developed market debt, rising a mere 100-150 basis points in aggregate over the last five years.
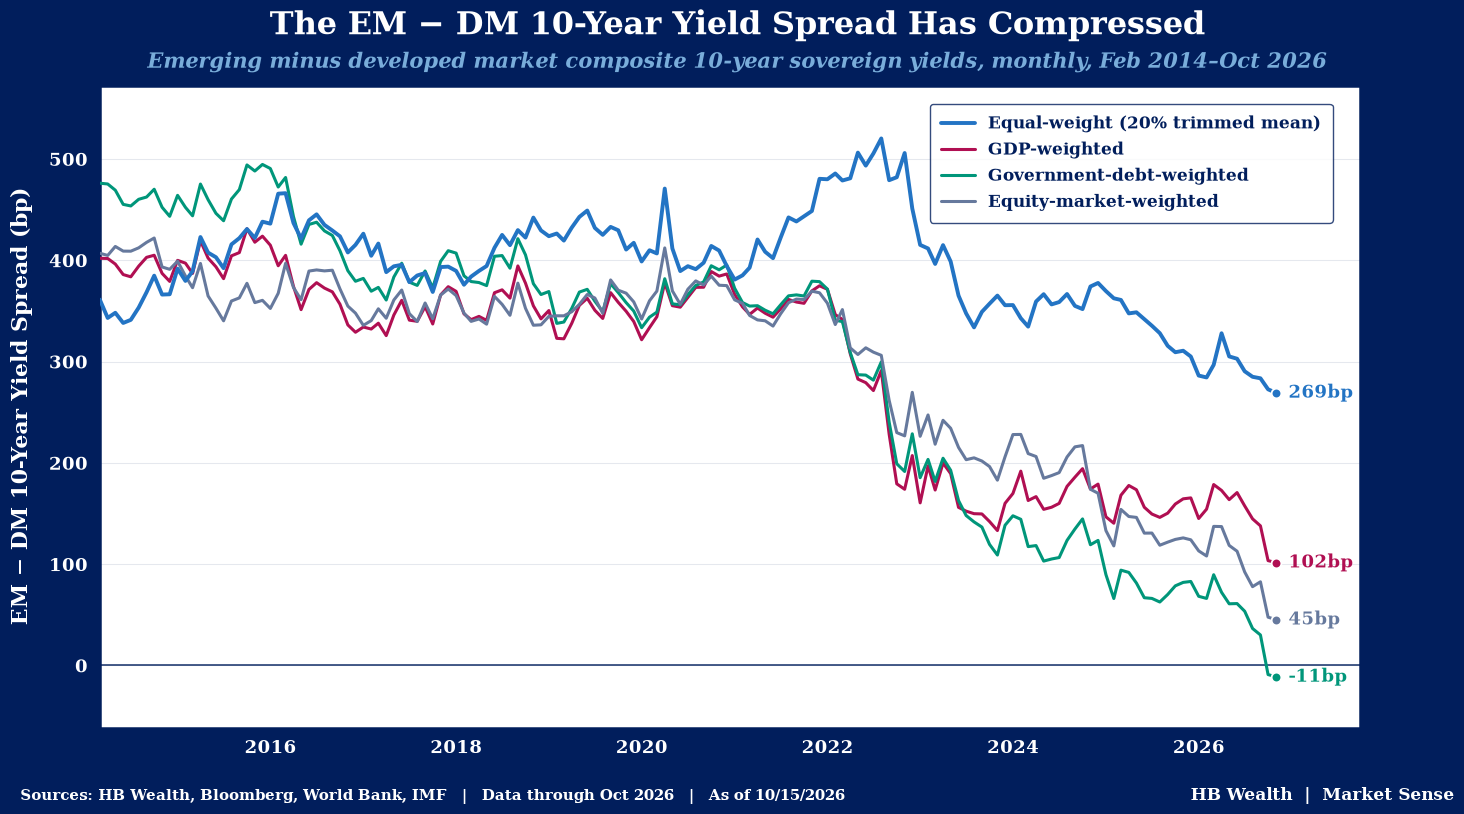
The spread compression has been so extreme that by at least one measure, 10-year emerging market sovereign yields are now lower than 10-year developed market sovereign yields for the first time in our records. On a debt-weighted basis (the standard measure utilized by index providers), emerging market 10-year sovereign debt is yielding 4.47%, slightly less than developed market sovereign debt, yielding 4.58%. The spread between developed and emerging market debt yields is now 11bps on a debt-weighted basis – inverted for the first time on record.
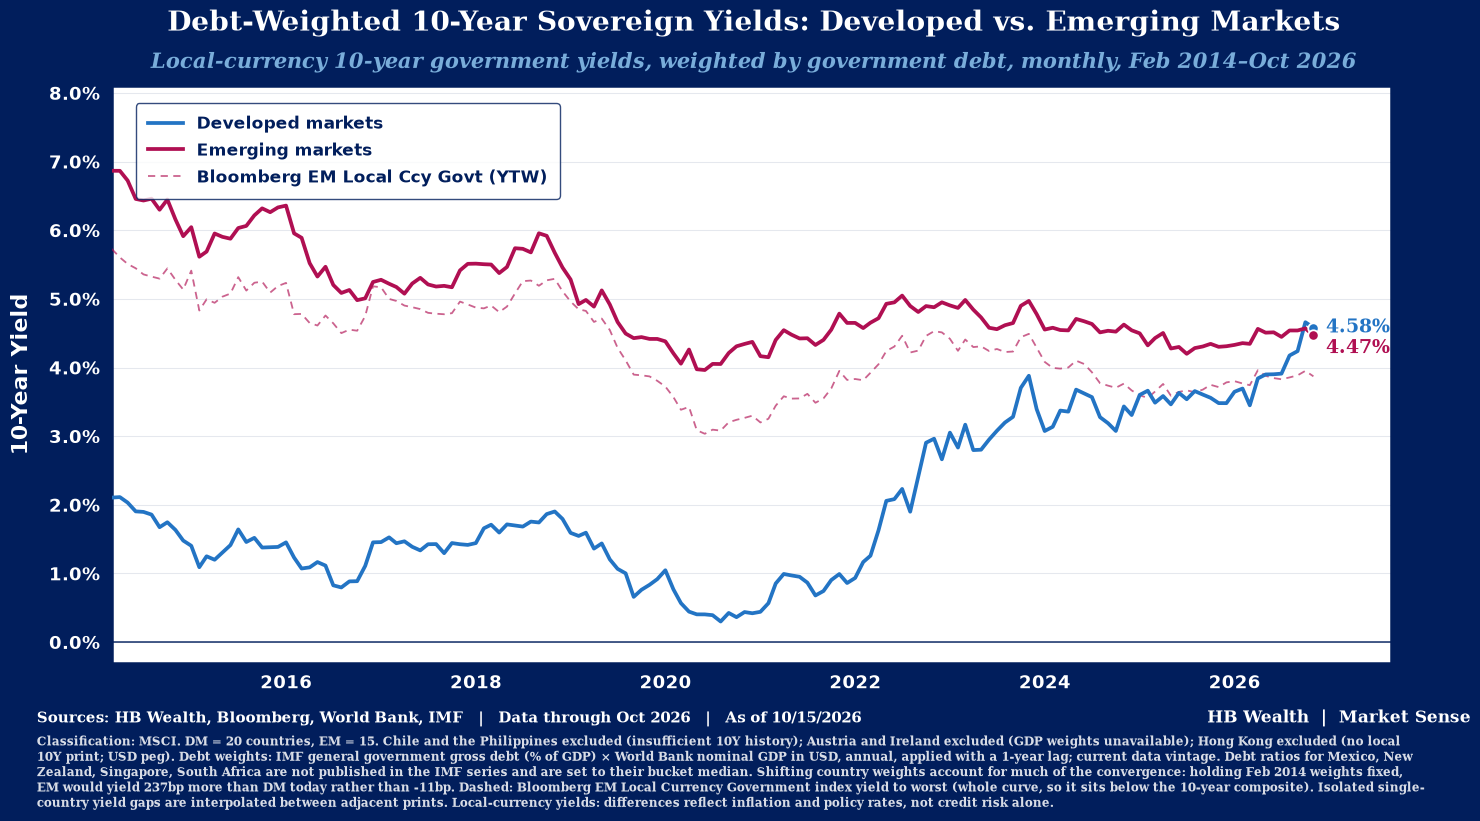
Much of the contrast between emerging market and developed market debt yields is as a result of divergent experiences for heavyweights U.S. and China, but that does not entirely explain the difference. U.S. 10-year Treasury yields have surged from under 1% to more than 5% since their pandemic lows, and yields are now near 20-year highs. Meanwhile, the yield on Chinese 10-year debt has fallen to 1.67%, near 20-year lows. However, 13 of the 20 developed markets we track have 10-year yields at or near 10-year highs, and 4 are at or near 20-year highs as improving nominal GDP prospects, rising inflation pressures, rising debt loads and fiscal deficits have generally hammered developed bond markets. Not one of the emerging markets countries that we track have 10-year debt yields at or near 10-year highs.
As a result of these broad shifts, most weighting methodologies (of which we tried 4) show developed markets as a group still able to borrow for 10-years at yields less than emerging markets, but the spread between the two is substantially lower than in the past. All show the same general trend of spread compression between developed and emerging markets, with the pandemic period the key break point. In the years leading up to the pandemic, emerging market 10-year sovereign debt yields were persistently 300-500 basis points above developed market yields. Since then, yield spreads between developed and emerging markets have compressed materially, particularly when country level yields are weighted on any measure that accounts for the size of the markets. Even on an equal weighted basis and after removing extremes, the yield spread is well below pre-pandemic norms.
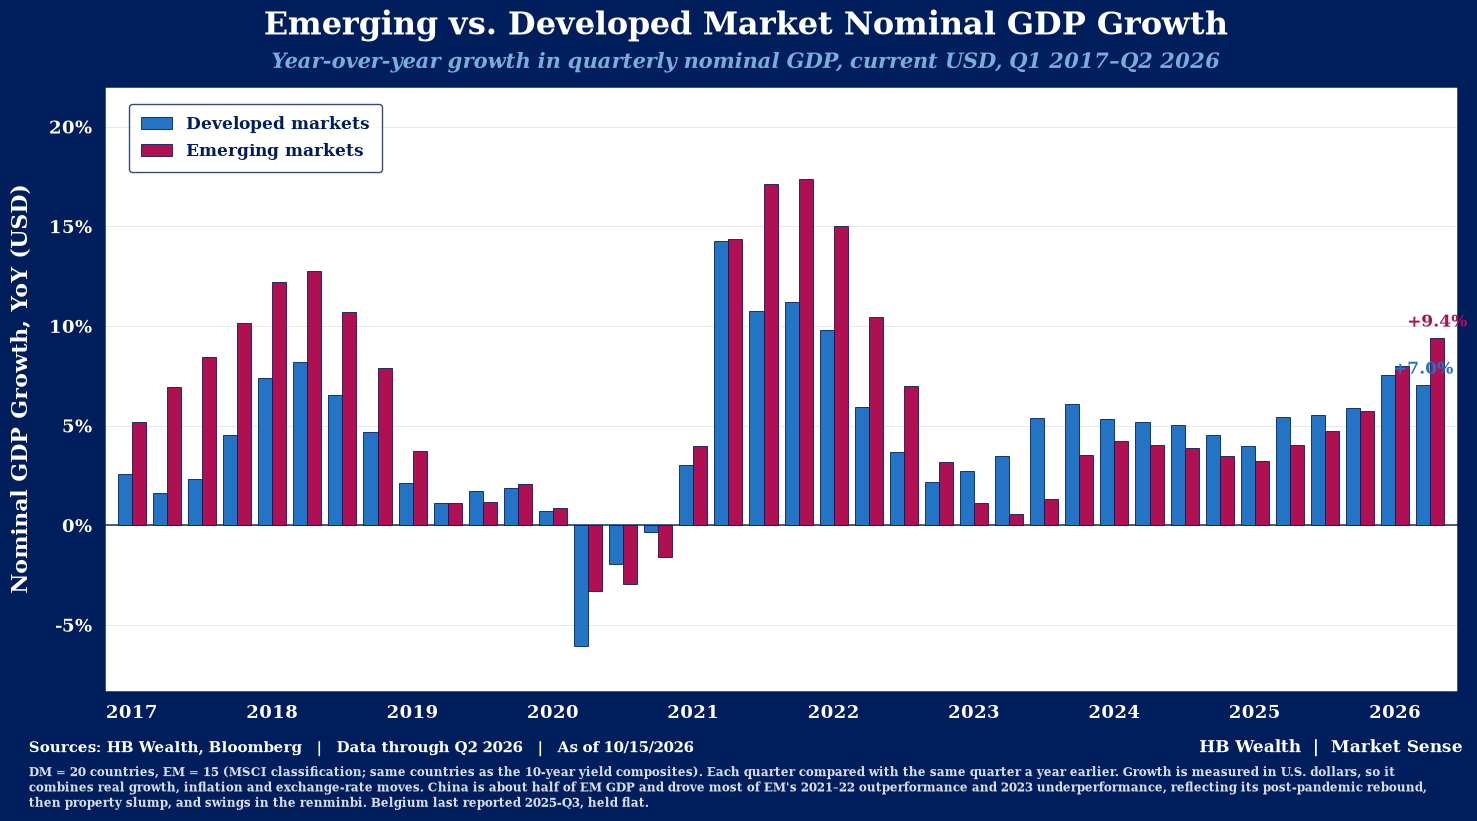
Nominal GDP growth trends are improving around the world, helping to explain some, but not all, of the rise in yields globally. Emerging market nominal GDP is accelerating faster than developed markets, but yields are not rising as much. So far this year, emerging economies have posted nominal GDP growth of 9.0% on average, while developed markets have posted nominal GDP growth of 7.3%. These figures are 5.2 and 2.6 percentage points, respectively, above growth posted in the first half of 2025, and 2.5 and 1.3 percentage points, respectively above 5-year average nominal growth for each group. Both segments are approaching, but not yet near pre-pandemic peaks reached in 2018, when emerging market nominal GDP touched 12.6% and developed market nominal GDP touched 8.1%.
Stronger growth prospects are only part of the story driving yields – government debt levels may help explain the recent divergence somewhat as well. Emerging market economies are relatively debt-light by comparison to developed market economies, particularly when China is excluded. In total, EM debt is 74% of GDP, below developed market debt of 108% of GDP. On account of slow growth and rising debt, China’s debt is about 100% of GDP, skewing the figure higher. However, the rest of emerging markets have generally lower debt, especially when markets like Korea and Taiwan are included. (Definitions of emerging versus developed markets can get a bit messy – the IMF sees Taiwan and Korea as advanced economies, but both are considered emerging in equity and debt markets.)
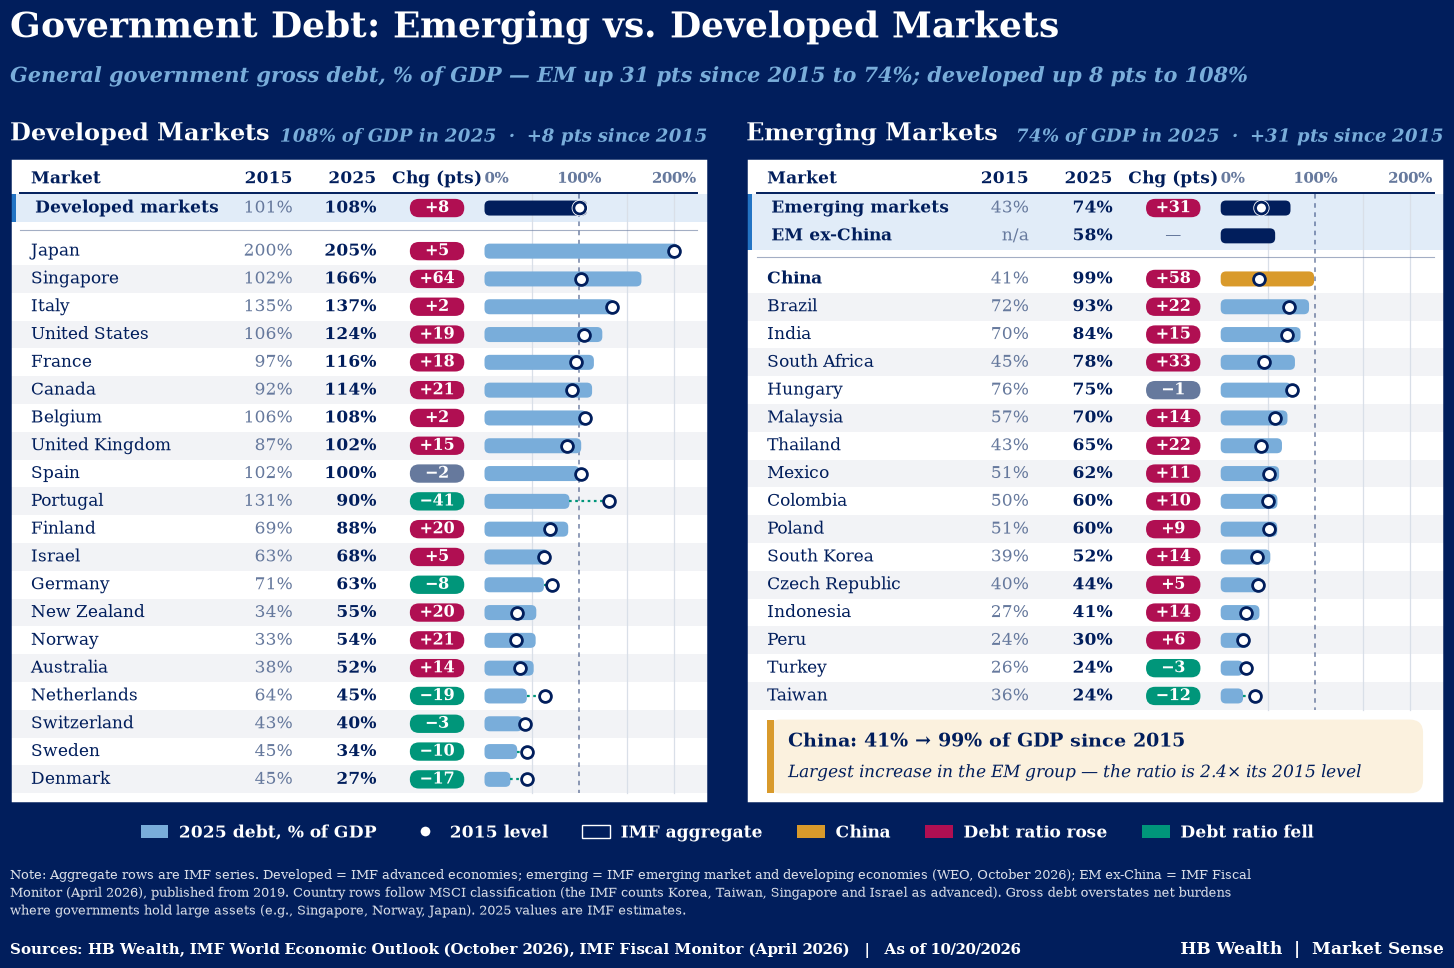
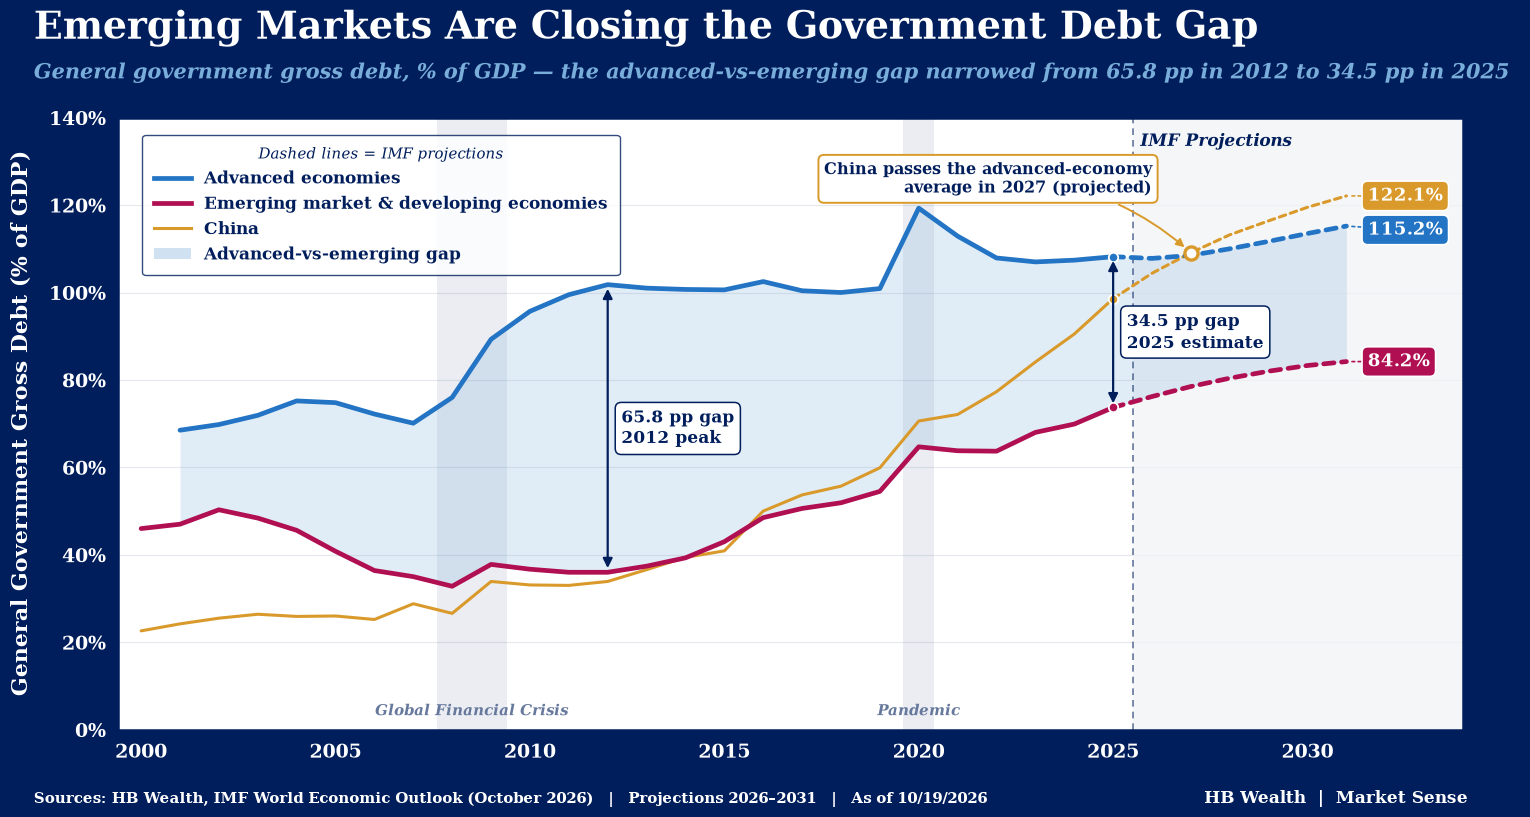
The IMF sees it likely that public debt will continue to climb, with advanced economy debt continuing to top emerging economy debt, even including the rise in Chinese debt. By 2031, debt is expected to rise from 108 percent of GDP in 2025 to 115 percent of GDP in advanced economies, and in emerging market and developing economies from 74 percent of GDP in 2025 to 84 percent of GDP in 2031.
High and rising debt levels, particularly in developed markets, are reflected in rising term premiums. The term premium captures the additional return investors require for the uncertainty of holding long-term bonds in a given market. In the United States, the term premium has risen from nearly zero in Covid to about 140 basis points this year. The term premium has accounted for about 1/3 of the rise in yields in the U.S. over the past year, according to the Federal Reserve. Meanwhile, the HB Wealth estimates that among developed markets, 17 of 20 countries have a term premium more than 50 basis points above its level ten years ago, as have 8 of the 13 emerging market countries in the study.
Disclosure: HB Wealth is an SEC‑registered investment adviser. The information reflects the author’s views, opinions, and analyses as the publication date. The information is provided for informational purposes only and does not constitute an offer to sell or a solicitation of an offer to buy any investment product. This information contains forward-looking statements, predictions, and forecasts (“forward-looking statements”) concerning the belief and opinions in respect to the future. Forward-looking statements involve risks and uncertainties, and undue reliance should not be placed on them. There can be no assurance that forward-looking statements will prove to be accurate, and actual results and future events could differ materially from those anticipated in such statements. The information does not represent legal, tax, accounting, or investment advice; recipients should consult their respective advisors regarding such matters. Certain information herein is based on third-party sources believed to be reliable, but which have not been independently verified. Past performance is not a guarantee or indicator of future results; inherent in any investment is the risk of loss.