








Abstract:
- Global equities add diversification to an equity portfolio over time, even with moderate to strong correlations with US stocks historically.
- Concentration risk is rising and tech’s influence is growing in emerging markets and in the US, but correlations still support the diversification benefit of foreign exposures.
- US valuations remain head and shoulders above the rest of the globe. Both emerging and developed markets are as a result discounted on both a forward and trailing basis relative to the MSCI ACWI index. Emerging markets are discounted in absolute terms as well.
- Earnings growth forecasts are the most robust for emerging markets and nominal GDP forecasts suggest the region could continue to grow faster than developed markets in the longer run.
Adding nondomestic stocks to an equity portfolio has clear diversification benefits, and both emerging and developed markets stocks are discounted to domestic peers. Strong earnings forecasts for the former hint the gap in multiples could close if consensus is correct, while resolution of turmoil in the Middle East may benefit the latter most. Economic forecasts for emerging markets remain significantly more robust than US and developed markets, supporting the stronger growth forecast for the group, but changing concentration in the stock gauge is notable. Emerging markets have quickly shifted from a financials-dominated gauge to one that carries roughly the same tech exposures and concentration risks as the US. Developed markets have a much more unique sector makeup compared to US peers but that hasn’t yet translated to lower correlations versus the US.
Emerging Markets Add Significant Diversification Benefits to Equity Portfolios
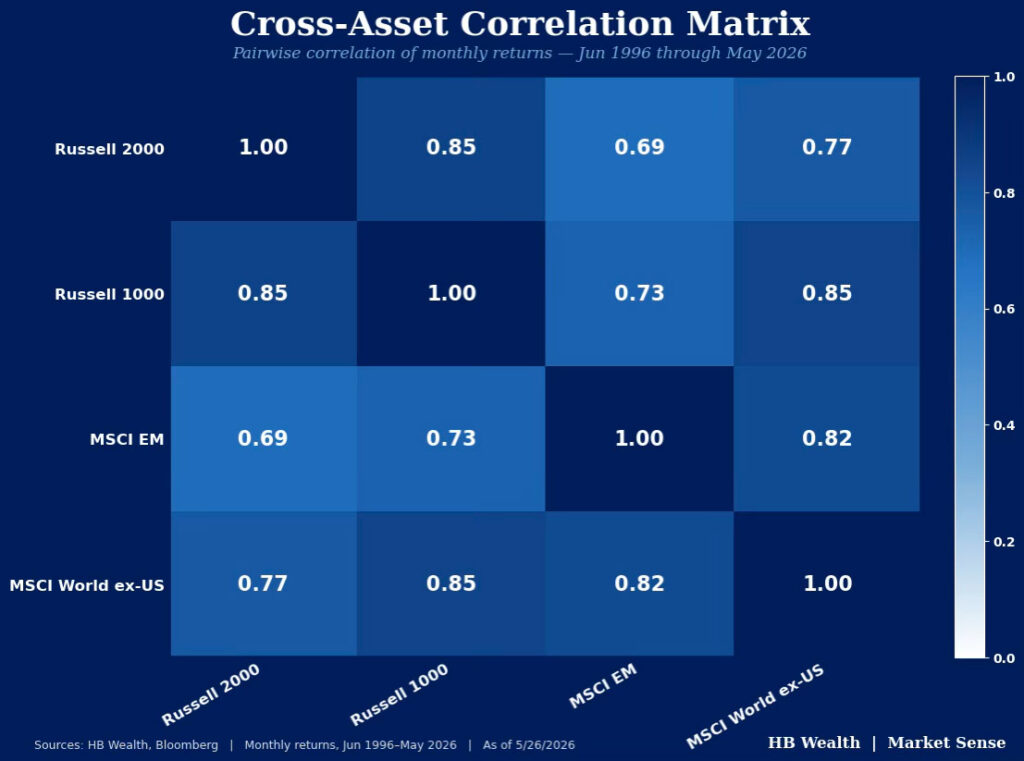
Even though domestic and nondomestic stocks are positively correlated, historical evidence suggests nondomestic equities still add diversification benefits to a U.S. equity portfolio. Based on monthly data back to 1990, rolling annual changes in the Russell 1000 are 0.78 and 0.5 correlated to changes in the MSCI Developed Markets ex-US and MSCI Emerging Markets index, respectively. While those numbers might appear high in isolation, there’s still a clear diversification benefit to adding foreign exposure to a US stock portfolio. For instance, an equal weighted combination of the Russell 1000 and emerging markets stocks has a diversification ratio of 1.09 based on Bloomberg’s MAC3 equity risk model while a portfolio of US and developed markets carries a diversification ratio of 1.06. All three assets together equally weighted have a 1.1 diversification ratio – anything above 1.0 indicates that combining the assets exhibits less ex-ante risk than the standalone portfolio. This shows that there has historically been some risk reduction from adding global stocks, especially emerging stocks, to a portfolio of US equities.
Concentration Risk is High in Both US and EM, Thanks to Tech
Elevated concentration thanks to the strong surge in tech stocks may slightly diminish but should not eliminate the diversification benefit of non-domestic equity exposure. Global stocks have fared very well so far this year with tech stocks leading the charge, but that’s also starting to drive some concentration risk concerns, especially across emerging markets. So far this year, the Russell 1000 is up 8.3% versus 6.1% and 19.3% for the MSCI developed markets ex-US and MSCI emerging markets benchmarks, respectively. Across all gauges of global stocks, the tech sector has outperformed to varying degrees – energy is the best performing sector so far this year across developed markets while tech tops the rest in emerging markets, but the technology sector is nonetheless outperforming benchmarks in all three major regional groupings.
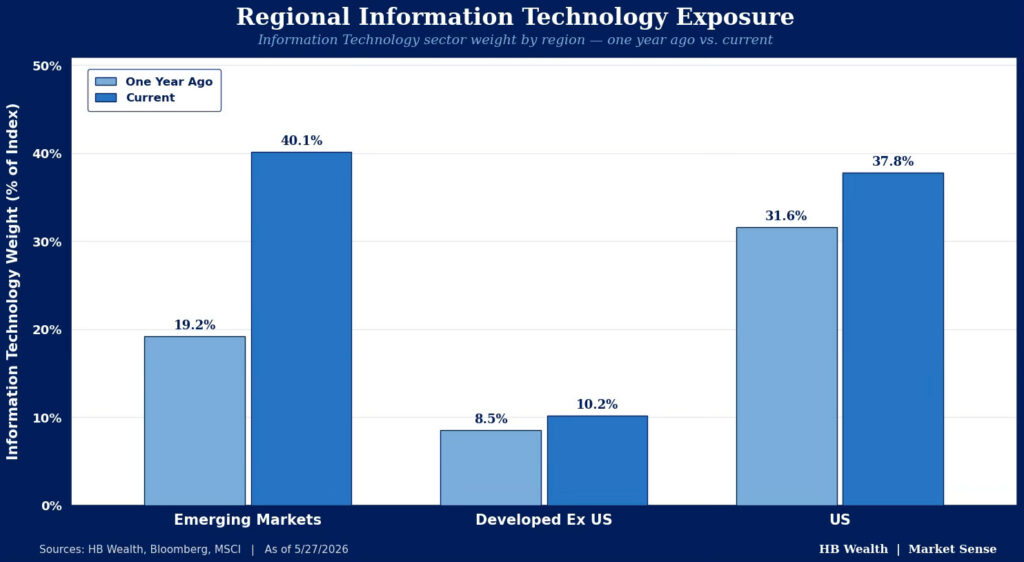
Thanks to its recent gains, the tech sector is growing in market cap share of all benchmarks. In emerging markets, tech is now 40.1% of the index’s weight – now surpassing financials as the largest sector in the equity benchmark and rivaling even the S&P 500’s 37.8% tech weight. While not as dramatic, tech’s percentage of developed markets has climbed from 8.5% to 10.2% over the past year. The sector is still the third largest in developed markets outside the US, behind financials & industrials.
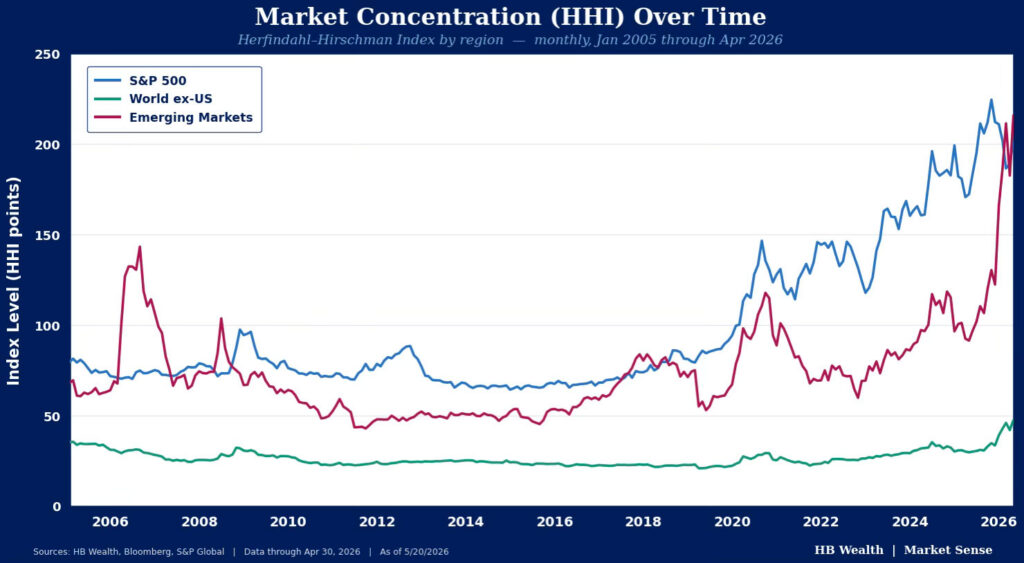
The global elevation of tech stocks is driving concentration risk concerns in the US as well as in emerging markets. While this is unlikely to fully erode the diversification benefit of emerging markets for US-dominant portfolios, it may result in a slightly higher correlation in the short run. Using the Herfindahl-Hirschman Index (HHI) to determine the number of stocks effectively driving each index’s gains now shows emerging markets (46 stocks) as the most concentrated, followed by the US (49 stocks) and developed markets (210 stocks).
Currently, the top 5 weights in the MSCI emerging markets index – TSMC, Samsung, Tencent, SK Hynix, and Alibaba – make up nearly 30% of the gauge. Likewise, this year’s returns have been nearly entirely driven by just three of those stocks with Samsung, TSMC and SK Hynix contributing 14.4 percentage points of the index’s year-to-date rise. Conversely, the top 5 contributors to the S&P 500’s return year-to-date – Nvidia, Apple, Micron, Alphabet, and AMD – have accounted for just under half the index’s gain, adding 441 bps to the index’s 9.7% rise. Meanwhile, the top 37 stocks in the developed market index add up to a 28% weight, and the top 5 weighted performers only added 1.8 percentage points to the benchmark’s year-to-date gain.
For most of the immediate pre- and post-pandemic period, emerging markets had been less concentrated than the US, and elevated levels of concentration occurred only infrequently, such as in 2018, when 12.7% of stocks were effectively driving emerging markets versus 24.7% in the US. Likewise, as US concentration rose in 2021, emerging markets followed suit. This elevated concentration did temporarily boost correlation – from 2015 through 2021, rolling annual correlations between the US and emerging markets were 0.83. Nonetheless, the two assets remained not perfectly correlated, suggesting emerging markets were still a diversifying asset.
Though developed market correlations to the US are higher over the long run than emerging market correlations, the group still offers some diversification benefits. Rolling annual correlations between the US and DM ex-US index have been above the long-term average since the pandemic, at 0.88, but lower concentration risk within the developed market index might hint at a decoupling of returns versus the US and increasing diversification benefit of adding those stocks to an equity portfolio. Meanwhile, deteriorating ties between the US and other parts of the developed world might add dispersion to market returns.
Valuations Support Global Stocks, Emerging Earnings Do Too
Discounted valuations combine with strong earnings growth prospects to boost the cyclical case for global equity exposure in addition to the secular case made by correlation. Despite the dramatic run-up in emerging markets stocks as of late, they’re considerably cheaper than global peers. On a forward P/E basis, the MSCI Emerging Markets index trades at 11.8x. While this is good for just 0.3 standard deviations above the average back to 2009, emerging markets are 1.5 standard deviations cheap to the norm relative to the MSCI ACWI index. Comparatively, the Russell 1000’s and developed markets’ respective 20.7x and 16x multiples are 1 and 1.2 standard deviations expensive versus their own long term historical averages. Relative to the MSCI ACWI index, other developed markets offer a 0.5 deviation discount versus a 0.3 deviation premium for the US.
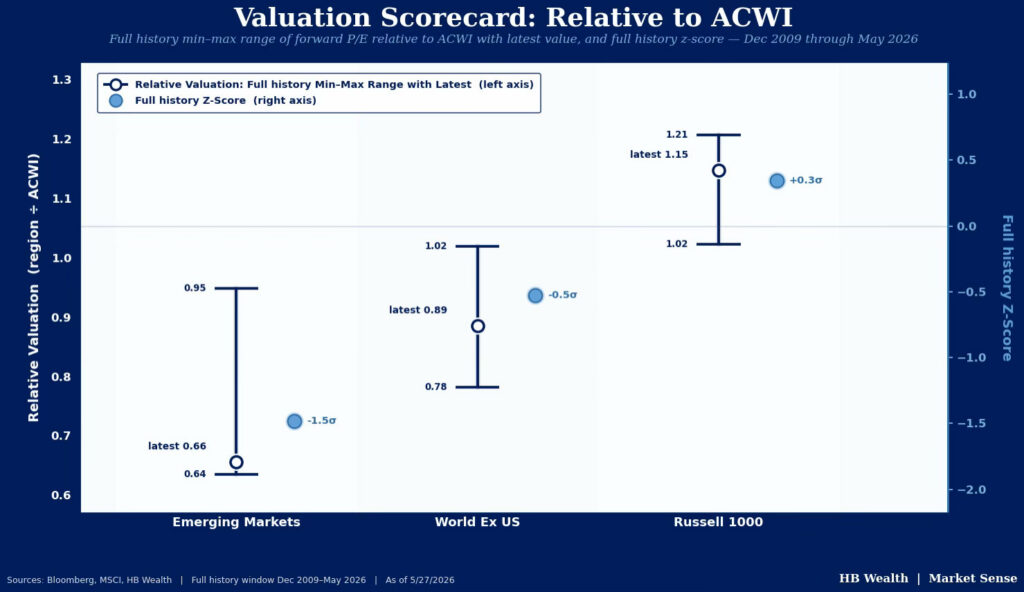
Like we have observed in US tech (see our Market Sense on tech valuations here) there’s a bit of a disconnect between trailing and forward multiples as estimates soar, but emerging markets are discounted to long term norms on both a trailing and forward basis. On a trailing 12-month earnings basis, emerging markets trade at 17.8x – still below developed markets’ 18.4x and the US multiple of 25x. Relative to the global equity market, that’s still 0.1 deviations below its long-term norm. That swing from clearly discounted to merely just a tad below the mean is thanks to a robust consensus earnings forecast for tech sector driven 50.6% emerging market EPS growth in the year ahead – easily surpassing developed markets’ 14.9% and the US’ 19.8% bogeys.
Economic Forecasts Are More Robust Across Emerging Markets
Emerging markets’ discount on both an absolute and relative basis appears out of balance with its more robust earnings growth outlook, and earnings growth in EM is about more than just the tech sector – it’s also about expected economic growth. The IMF’s forecasts for economic growth are significantly lower than history across the globe, but they’re still the strongest for the emerging market cohort, hinting that EM forward earnings growth could remain a source of strength for the group. Applying the country weights in the MSCI emerging market and developed market index to both the historical average (since 1981) and forward 5-year nominal GDP forecasts (in dollars) shows that while long term weighted average emerging market economic growth may slow from a run rate of 8.1% year-over-year to about 5.5% over the next 5-years, it’s still better than the other main regions globally. Over the next half decade, the IMF thinks the US could average just 3.8% growth versus its 5.5% norm since 1981, while the weighted average for developed markets lands at 3.8%. Over the long run, the country weighted developed markets cohort has averaged a 4.8% pace of economic growth.
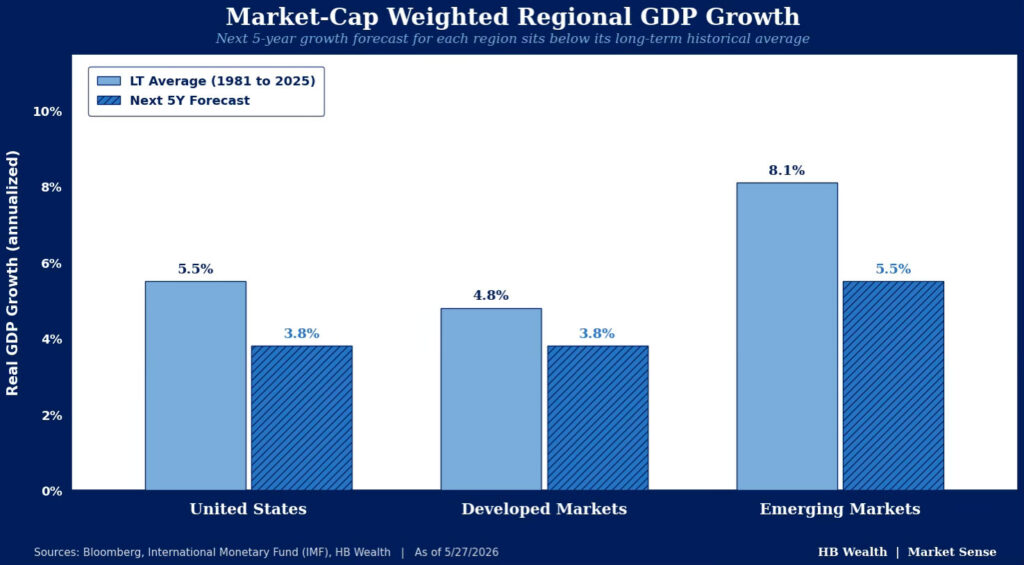
That context is especially important for the relative earnings growth landscape across each of these key regions. Predominant academic literature suggests that over the long run, corporate earnings can’t expand faster than nominal GDP. Even though we know that in any given quarter or year, this relationship doesn’t necessarily hold — for example in 1Q26 S&P 500 earnings are on pace for a 25.8% rise versus a 6% rise in US nominal GDP – it offers a key data point on which to ground long-run expectations
Disclosure: HB Wealth is an SECregistered investment adviser. The information reflects the author’s views, opinions, and analyses as the publication date. The information is provided for informational purposes only and does not constitute an offer to sell or a solicitation of an offer to buy any investment product. This information contains forward-looking statements, predictions, and forecasts (“forward-looking statements”) concerning the belief and opinions in respect to the future. Forward-looking statements involve risks and uncertainties, and undue reliance should not be placed on them. There can be no assurance that forward-looking statements will prove to be accurate, and actual results and future events could differ materially from those anticipated in such statements. The information does not represent legal, tax, accounting, or investment advice; recipients should consult their respective advisors regarding such matters. Certain information herein is based on third-party sources believed to be reliable, but which have not been independently verified. Past performance is not a guarantee or indicator of future results; inherent in any investment is the risk of loss.