Abstract:
- The manufacturing economy has been in a recession since 2022 but appears to finally be turning a corner. This supports the outlook for small cap stocks relative to large caps
- Technology was the only manufacturing industry growing prior to 2026, resulting in a “K-shaped” experience in U.S. manufacturing. Other industries like chemicals, machinery and transportation industries now appear to be recovering.
- The lack of a “V-shaped” manufacturing bounce over the last three years has held returns for economic-sensitive stocks like small caps at bay, resulting in a performance shortfall relative to large caps that has started to close over the last year. If the recent manufacturing recovery expands to more industries, expected equity returns may continue to improve.
After a Three-Year Recession, Manufacturing Might Be Turning the Corner
The manufacturing economy may be turning a corner for the first time in three years, and this could support new leadership in US stocks. Measures of manufacturing activity have hinted at a recession-like experience for the last several years, as robust technology activity has contrasted with contraction in other industries. However, there are some signs that the tide is beginning to turn. As other industries show signs of growth, the ISM manufacturing survey has bounced into expansion to kick off 2026. Growth is still too slow to suggest the economy at large has reached escape velocity, and this may keep large cap stocks’ returns somewhat constrained, but recovery in lagging industries may support rotation in U.S. equites that favors small cap stocks.
Purchasing Managers Indexes Hit Inflection
The ISM manufacturing survey has had just three consecutive positive readings so far in 2026, the first time since November 2022- the longest stretch on record without a meaningful expansion. The flip to expansion this year in ISM’s gauge has been led by a relatively healthy combination of new orders, production and supplier deliveries. During the initial recovery from the Covid-19 recession, supply chains were stretched amid a surge in orders – helping drive the extreme price inflation that haunted the economy and forced the Federal Reserve’s hand toward an aggressive rate hike and quantitative tightening cycle from 2022-2024. This experience also led to a surge in inventories that plagued the manufacturing sector for years. Overstocking for what turned out to be a very slow growth environment amid inflation pressures led to a prolonged period of inventory drawdowns and sluggish orders – until 2026.
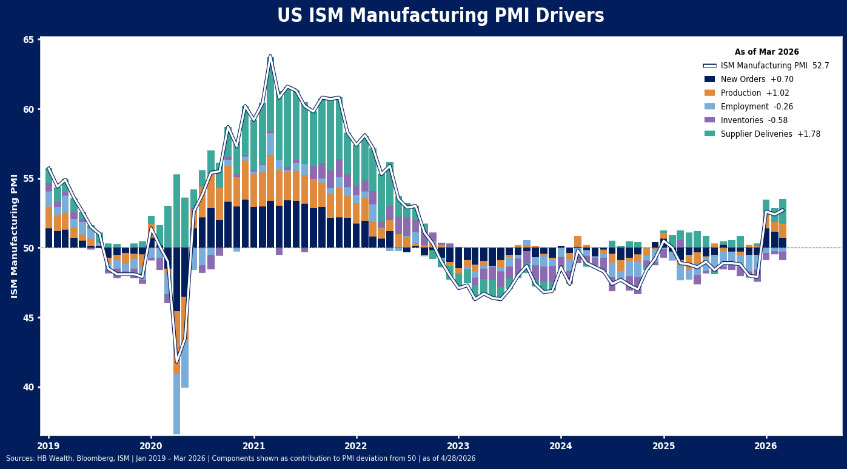
In the first three months of 2026, manufacturing jumped into expansion territory, powered by new orders, production and supplier deliveries. Notably, these recoveries overwhelmed a continued drag from inventories on the headline results. While war-time escalation in oil prices remains a risk to the outlook, there is very little evidence of impact so far in regional Fed surveys of manufacturing activity, which continue to paint a broadly constructive manufacturing picture.
The national ISM manufacturing survey will be released later this week, but NY and Philly beat expectations convincingly, Kansas City and Richmond held in expansion, and Dallas edged down. The consistent thread across all five is sharply rising price pressures, particularly for inputs, likely reflecting energy cost pass-through from the current Middle East situation, but not enough to throw the sector back into recession territory.
K-Shaped Manufacturing Economy Could be Changing in 2026
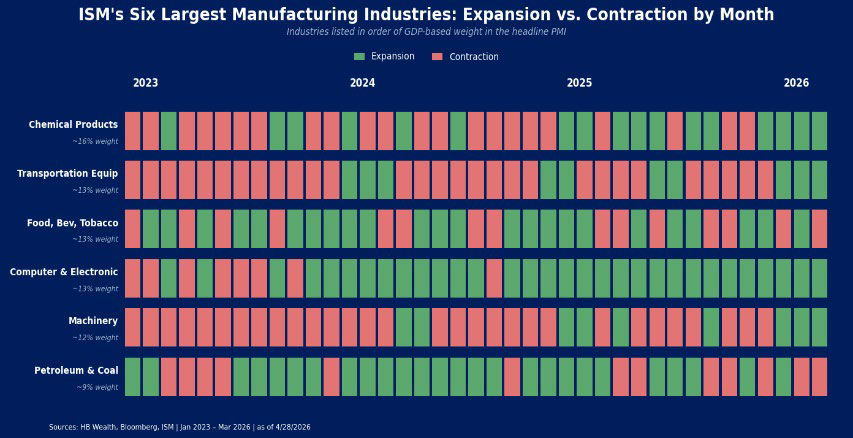
Sectoral details within manufacturing may be most critical to watch if the broadening trade that started this year is to continue. After several years in which technology was the only consistent contributor to manufacturing output among major industries, other industries have started to emerge from contraction in 2026. Our summary of readings across the six largest industries in the ISM’s survey shows how dominant computer and electronics has been as other industries struggled in contraction in recent years. Supported by data center and AI hardware demand, technology manufacturing expanded throughout most of 2024 and 2025, but it was joined only fleetingly by other segments such as chemical products, transportation, consumer staples and machinery. Those other groups are finally experiencing some expansion in 2026.
Industrial production, a measure of manufacturing output, shows clearly the degree to which tech single-handedly grew while other sectors languished in recent years. High-tech production has jumped by about 50% in the post-pandemic era, leaving behind other groups, where production is still below pre-pandemic levels.
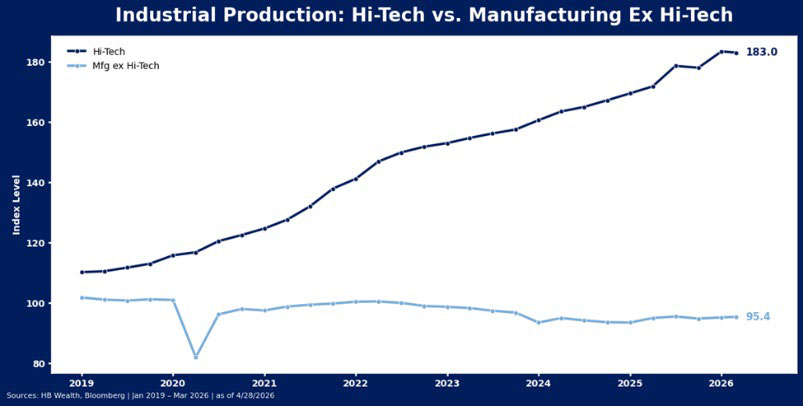
Momentum in production has slowed a touch recently, as the business optimism evident in the ISM surveys of manufacturing businesses has not yet translated into real economic activity. The tech surge was enough to create growth in industrial production at large since early 2025, but recent sputters for tech spending may suggest a need for other sectors to contribute to keep overall production rising.
As a result of the concentration in tech and limited improvement in other production industries so far, capacity utilization (which measures the extent to which the US economy is using its production capabilities) has been trending lower since the initial recovery from the covid-19 recession. Now at 75.7%, it is approaching the 75% level that typically indicates manufacturing recession in the U.S.
Both ISM manufacturing PMI and capacity utilization are key inputs into our economic cycle model that we last published on here (Market Sense Deep Dive: Goldilocks May Lower Stocks’ Temperature). In 2026, the model has indicated somewhat lackluster returns are likely for the broad market, as the economy struggles with mediocre – not too hot, nor too cold – growth. Maximum potential returns for stocks, as signaled by the economic cycle, likely passed with manufacturing activity contraction, and so far, the second-best state for market returns – robust growth – remains elusive. Continued acceleration in non-tech industry activity could help the economy achieve lift-off and improve prospective returns.
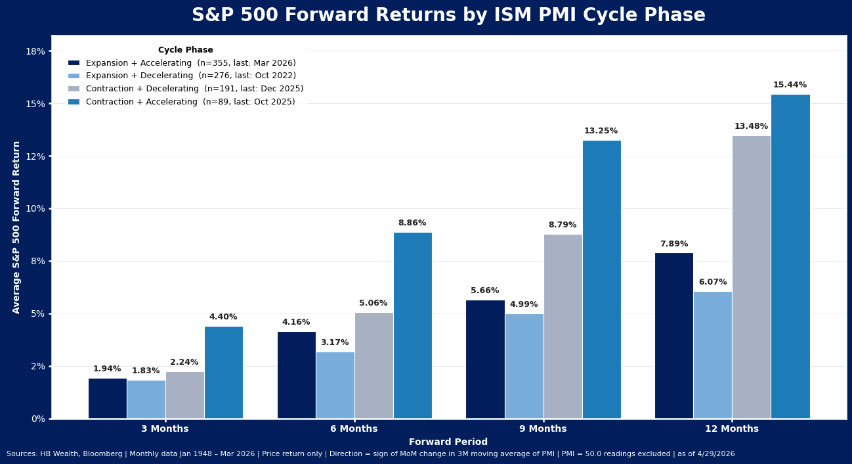
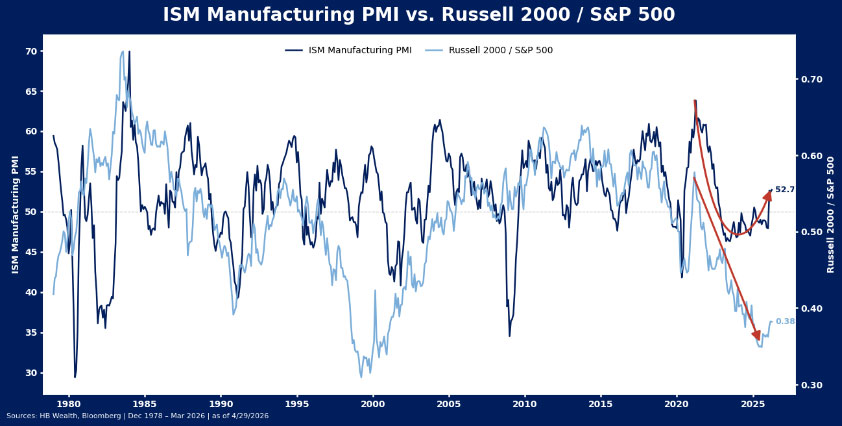
In the meantime, and as we noted in our note (Market Sense: With Small Caps Leading the Way, U.S. Stocks’ Role Reversal Has Legs), stronger manufacturing activity may remain a support for Russell 2000 forward performance. Small caps have historically traded in pretty close alignment with the ISM, outperforming large caps when ISM rose and underperforming when ISM fell. Like large caps, small caps historically performed best when the ISM was in contraction, but recovering from its low. This recent period of K-shaped recovery has been particularly challenging for small caps, as the normal sequence of sharp drop and subsequent recovery (otherwise knows as a “V-bottom”) did not occur in manufacturing, resulting in unusually lackluster performance for the style. If the ISM continues to accelerate in expansion territory, turning what has been a K-shaped recovery into more of a V-shape, we expect small caps may start to make up ground relative to large caps.
Disclosure: HB Wealth is an SEC registered investment adviser. The information reflects the author’s views, opinions, and analyses as the publication date. The information is provided for informational purposes only and does not constitute an offer to sell or a solicitation of an offer to buy any investment product. This information contains forward-looking statements, predictions, and forecasts (“forward-looking statements”) concerning the belief and opinions in respect to the future. Forward-looking statements involve risks and uncertainties, and undue reliance should not be placed on them. There can be no assurance that forward-looking statements will prove to be accurate, and actual results and future events could differ materially from those anticipated in such statements. The information does not represent legal, tax, accounting, or investment advice; recipients should consult their respective advisors regarding such matters. Certain information herein is based on third-party sources believed to be reliable, but which have not been independently verified. Past performance is not a guarantee or indicator of future results; inherent in any investment is the risk of loss.