








Abstract:
- Contrary to popular belief, evidence from large investment cycles of the last 150 years shows there is no consistent “playbook” for how an investment boom emerges and fades in stock prices.
- The telecom and fiber boom of the 1990s sparked a rapid acceleration and subsequent decline in prices, while the highway and railroad booms started more slowly, and gathered stock price momentum after several years.
- Electrification was the only investment boom that led to lower real stock prices 10 years after its start. Despite the volatility in stock prices affiliated with the telecom build-out, the S&P 500 was up 62% in real terms 10 years after its start. Highway and railroad builds accompanied 78% and 85% gains, respectively, over 10 years.
- Earnings growth in the AI-investment era is strongest among peer comparisons of the last 150 years. Just over 3 years into the AI build, earnings are up 33%. The 40 months of the telecom-fiber era showed earnings growth of 10% and for the comparable period in the railroad era, earnings rose 19%.
- Thus, the gap between price and earnings growth in the first forty months of the AI Buildout is about 20 points, significantly lower than 92-point gap that developed by this stage of the telecom build and the 38-point gap that developed in the highway build.
- The 20% valuation gain affiliated with the AI boom is still very limited by comparison to past booms. On average, P/E had accelerated 55% from its trough by the time stock prices peaked in the other major investment periods of the last 150 years.
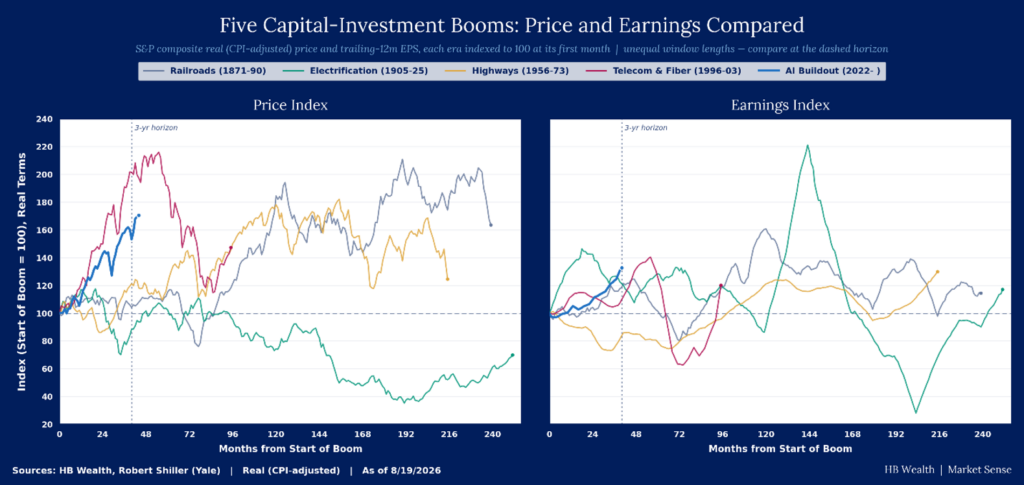
Contrary to popular narratives, investment booms of the last 150 years do not show a consistent boom-bust cycle pattern in stocks. Each case recorded a remarkably different price pattern. Some started slow and built equity market optimism over long periods, others raced hard at the start and ended early. And at least one had no evident impact on stock prices, as investment did not show up in earnings for decades. Broadly, stock prices have tended to extrapolate earnings trends during booms, but those earnings trends vary considerably.
Nonetheless, stock prices are off to an unusually strong start compared to investment booms of the last 150 years. Real stock prices have gained 71% during the AI-investment boom that started at the end of 2022, second only to the telecom and fiber buildout of the 1990s, when the first 3 years sparked a 91% price gain. The three other booms – highways in the 1960s, electrification at the start of the 20th century and railroads in the late 1800s – all took much longer to spark enthusiasm in markets. Gains during the first three years of those experiences averaged just 1%.
While real stock prices surged quickly with the telecom and fiber build-out and reversed a majority of those gains by 2003, market gains affiliated with the railroad and highway investment booms endured much longer. The investment cycle was longer in those cases. While the telecom and fiber buildout was just 8 years, the other major investment cycles of the last 150 years were all 18-21 years long. The shorter investment period for telecom-fiber may partly explain why the duration of the market enthusiasm for it was materially shorter as well.
Electrification was the only investment boom affiliated with lower stock prices. Ten years after the start of that investment boom, real stock prices were down 26% as earnings growth from the innovation was scarce. Despite the volatility in stock prices affiliated with the telecom build-out, the S&P 500 was up 62% in real terms 10-years after its start. Highway and railroad investment periods accompanied 78% and 85% real gains in stocks, respectively, 10-years from their beginnings.
Prices Zig When Earnings Zag During Booms
Broad market earnings growth during the AI buildout is so far topping all other investment booms of the last 150 years. Just over 3 years into the build, earnings are up 33%, significantly more than the comparable period at the start of other major investment cycles. The 40 months of the telecom-fiber era showed earnings growth of 10% and for the comparable period in the railroad era, earnings rose 19%.
While the relationship between stock prices and earnings trends is not one-for-one during investment booms, price patterns generally followed earnings peaks and troughs during prior cycles. Notably, stock price gains affiliated with the telecom and fiber build out peaked just before and troughed just after earnings. Price movements during the highway and railroad buildouts showed a similar link to earnings trends.
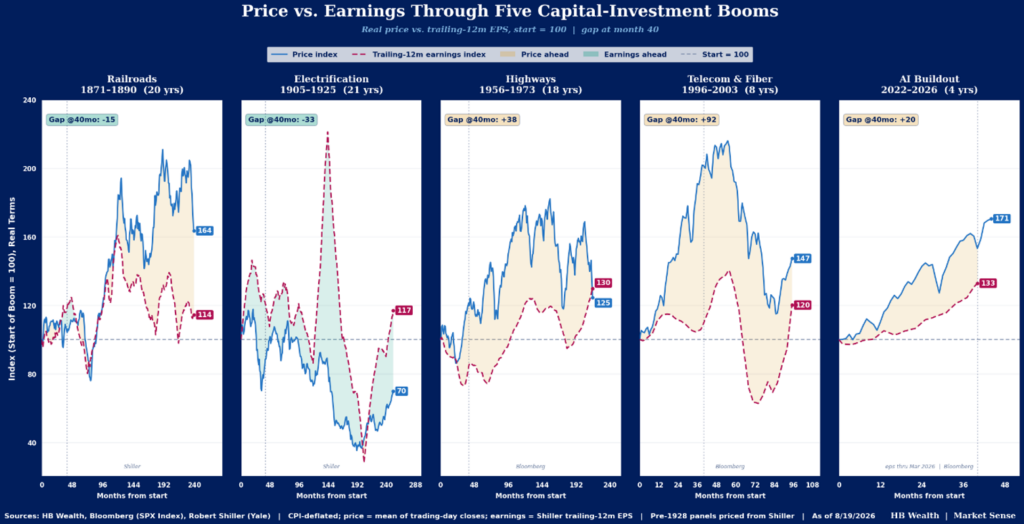
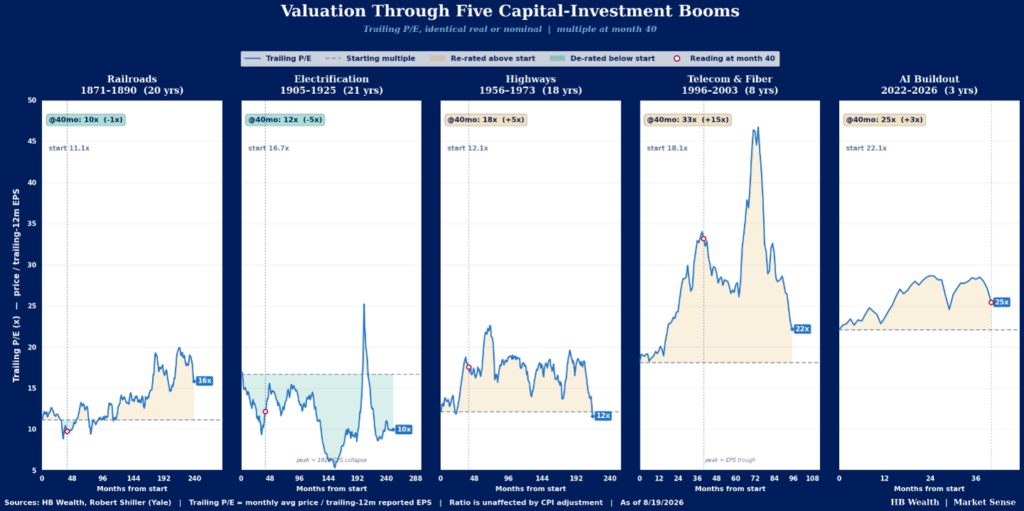
In all but the electrification age, prices rose faster than earnings, resulting in elevated valuations by the end of each boom, but the valuation excesses varied by era. The gap between price and earnings growth in the first forty months of the AI Buildout is about 20 points, significantly lower than 92 point gap that had developed by this stage of the telecom build and the 38 point gap that had developed by this stage in the highway build. While market P/E has jumped about 20% to 25X from its starting point of 22X over the last 40 months, the multiple rose more than 80% – from 18.1X to 33X – in the first 40 months of the telecom build out. The highway investment boom also showed significantly more valuation expansion of nearly 50%, from 12.1 to 18 P/E. In the early stages of both electrification and railroads, prices rose more slowly than earnings.
At respective peaks, the gap between price and earnings growth was 85 points during the railroad boom, 67 points during the highway boom and 99 points during the fiber buildout at the turn of the century.
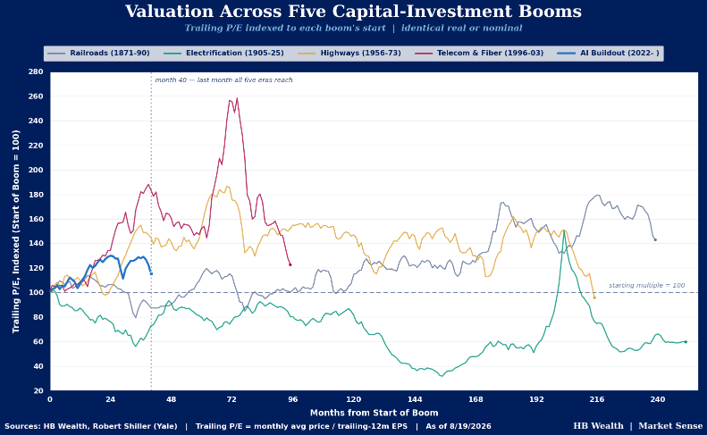
Because earnings have grown so quickly, valuation expansion in the AI-era has been limited compared to valuation expansion concurrent to the telecom and highway investment eras. Also, every other investment boom ended with more valuation expansion than has so far occurred with the AI-boom.
At the peak in stock prices in 2000, P/E had jumped 55%. At the stock price peak affiliated with highway investment, in 1968 (13 years in), P/E had jumped 53%. It took 16 years before stock prices peaked in the railroad investment era, but by then P/E had risen 61%. All of these make the 20% AI-boom acceleration in P/E so far look rather benign by comparison. Only electrification, which showed no market-affiliated enthusiasm, had less valuation expansion than the AI-era thus far.
Disclosure: HB Wealth is an SECregistered investment adviser. The information reflects the author’s views, opinions, and analyses as the publication date. The information is provided for informational purposes only and does not constitute an offer to sell or a solicitation of an offer to buy any investment product. This information contains forward-looking statements, predictions, and forecasts (“forward-looking statements”) concerning the belief and opinions in respect to the future. Forward-looking statements involve risks and uncertainties, and undue reliance should not be placed on them. There can be no assurance that forward-looking statements will prove to be accurate, and actual results and future events could differ materially from those anticipated in such statements. The information does not represent legal, tax, accounting, or investment advice; recipients should consult their respective advisors regarding such matters. Certain information herein is based on third-party sources believed to be reliable, but which have not been independently verified. Past performance is not a guarantee or indicator of future results; inherent in any investment is the risk of loss.