








Abstract:
- Stocks have had a volatile summer, but improving breadth shows the bull market still well intact.
- The equal-weighted S&P 500 is outperforming the cap-weighted version and small caps are outperforming large caps as market wobbles have been somewhat concentrated in large cap growth stocks.
- Sector performance trends show vast divergences when viewed on an equal versus capitalization-weighted basis, particularly as of late. So far this quarter, equal weighted tech is performing nearly in line with the benchmark, while market-cap weighted tech is struggling, for instance.
- Our sector model uses the Bloomberg 1000 equal weight as the benchmark and currently favors energy, tech and materials while disfavoring communications, real estate and financials. Energy has been the best performing sector this quarter and materials has also led its benchmark by 66 bps on an equal weighted basis. Financials performance has most positively surprised the model.
Breadth Sending Bullish Cues as Capitalization Distorts Sector View
Resurgent price breadth and a preference for smaller-cap shares in 2026 have caused the equal weighted Bloomberg 1000 to outperform its cap weighted peer and are likewise driving some notable sector performance divergences. Breadth has recovered smartly after a huge drop in the percentage of companies trading above their 50-day and 200-day moving averages as a result of the war in Iran. Currently, both measures are approaching year-to-date highs at nearly 71%, easily eclipsing the long-term averages of 57% and 62%, respectively, showing very strong participation in this year’s rally. Likewise, smaller capitalization stocks have outperformed larger peers by 187 bps this year. Both these factors have helped the equal weighted Bloomberg 1000 lead the cap weighted version by 92 bps this year.
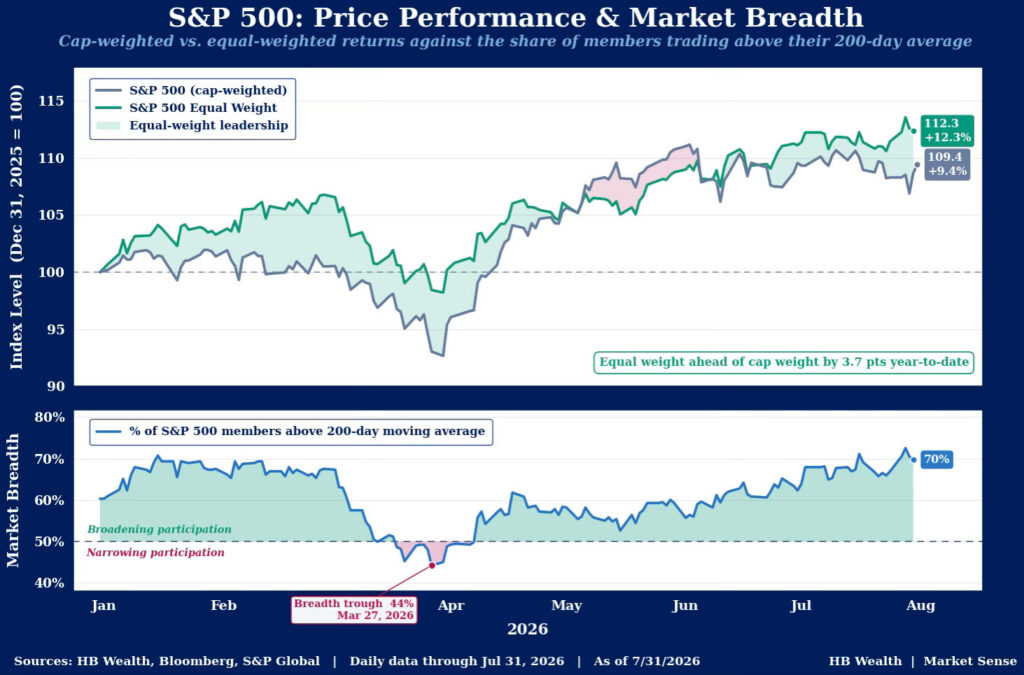
Market of Stocks Looks Stronger than the Stock Market at Large
Strong participation in the market rally is currently being masked by large variations in performance among some of the market’s largest companies, however, and this is leading to significant sector distortions. In 2026, equal weighted Bloomberg 1000 tech is up 35.7% — second only to equal-weighted energy’s 35.8% leading gain among sectors, and much stronger than the 24% rise in the cap-weighted version of the sector. In contrast, cap-weighted energy gained 32.6%. Likewise, communications’ mega caps have somewhat masked a broad-based drop in the sector, leading to a 2.9% drop in the equal weighted sector versus a 3.8% rise in the cap weighted version. Health care has the third widest gap between equal and cap-weighted gains at 592 bps and a whopping nine of 11 GICS equal weighted groups have outperformed cap-weighted peers. So far in the third quarter, eight of 11 equal weighted GICS sectors are leading cap weighted peers amid 24 bps of outperformance for the equal weighted Bloomberg 1000. Health care (233 bps) and materials (228 bps) have outperformed cap-weighted brethren by the most this quarter.
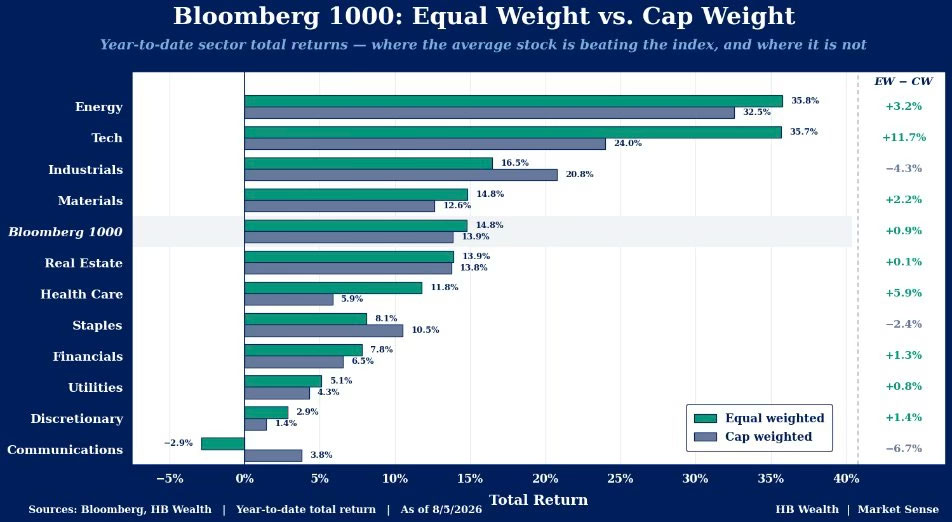
Recall that for our sector model, we use the Bloomberg 1000 equal weight as the benchmark. The model currently favors energy, tech and materials and disfavors communications, real estate and financials. So far, energy has been the best performing sector this quarter and materials has also led its benchmark by 66 bps on an equal weighted basis. Tech has lagged by 81 bps. Likewise, communications (161 bps) and real estate (136 bps) have struggled. Financials has sharply outperformed expectations with 479 bps of outperformance to the benchmark.
Disclosure: HB Wealth is an SECregistered investment adviser. The information reflects the author’s views, opinions, and analyses as the publication date. The information is provided for informational purposes only and does not constitute an offer to sell or a solicitation of an offer to buy any investment product. This information contains forward-looking statements, predictions, and forecasts (“forward-looking statements”) concerning the belief and opinions in respect to the future. Forward-looking statements involve risks and uncertainties, and undue reliance should not be placed on them. There can be no assurance that forward-looking statements will prove to be accurate, and actual results and future events could differ materially from those anticipated in such statements. The information does not represent legal, tax, accounting, or investment advice; recipients should consult their respective advisors regarding such matters. Certain information herein is based on third-party sources believed to be reliable, but which have not been independently verified. Past performance is not a guarantee or indicator of future results; inherent in any investment is the risk of loss.