


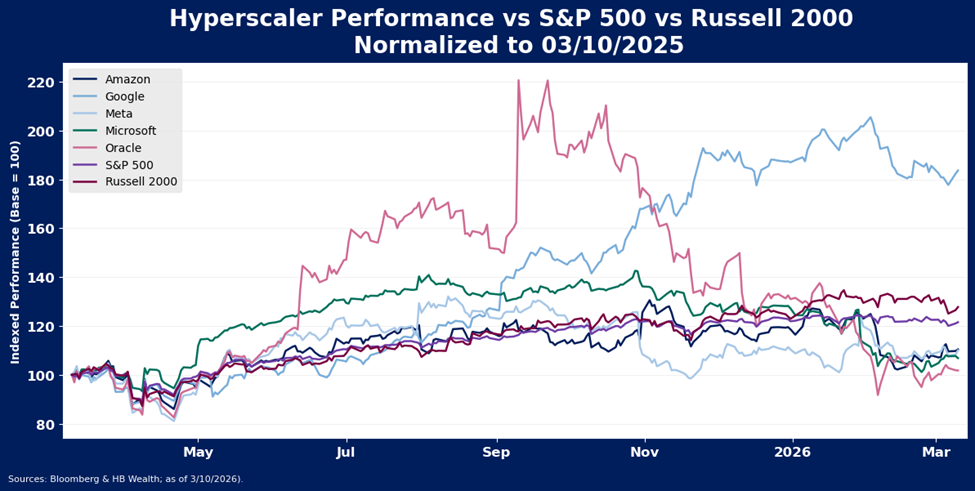
U.S. stocks remain off their highs and despite some relative performance improvement since the war in the Middle East broke out, have underperformed international stocks on a trailing 1-year and year to date basis. Stocks of the five hyperscalers are down 9.3% as a group in 2026, and only Alphabet has managed to outperform the index this year.
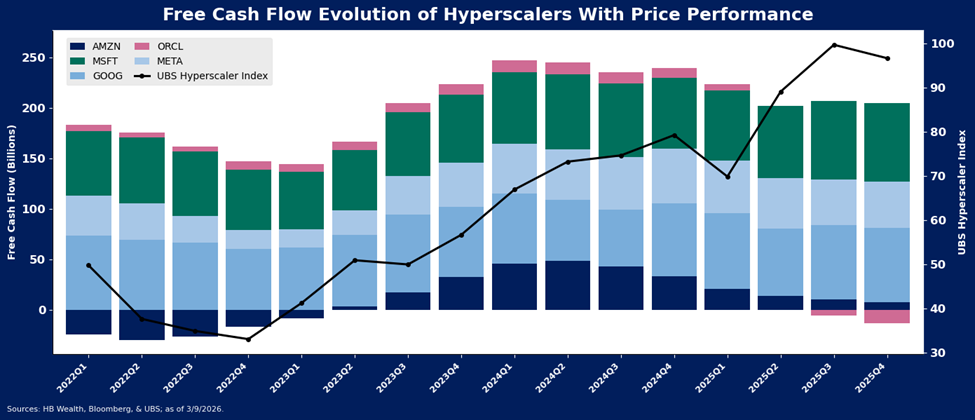
These hyperscalers have been a large detractor from US equity performance as cash flows have suffered under the weight of elevated capital spending. In aggregate, group free cash flow (FCF) dropped 23.7% in 2025 from 2024, and three of the five hyperscalers recorded lower FCF last year compared to the prior year.
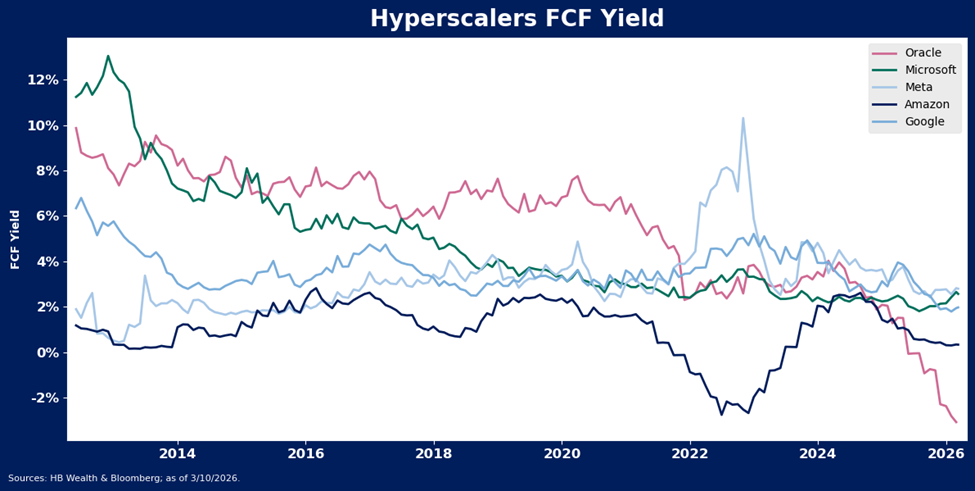
Valuations are additionally problematic. Four of the five hyperscalers still have a lower FCF yield than they did in 2024 and three have a lower yield than their 5-year average. Free cash flow for the group is at a level last recorded in September 2023, while stock prices are 63.4% higher than that point.
The U.S. market may remain a laggard until the group free cash flow trend improves materially. For the year ahead, the market is forecasting revenue growth of 16.5% for the group, compared to 14% in 2025 and 18% in 2024. Capex rose about 70% last year, significantly outpacing revenue growth. The group is still anticipated to spend about $650 billion this year, representing growth of 40%.
Hyperscalers Have Lost Their Hype
The U.S. equity market lost its hype well before war in the Middle East sparked a wave of renewed volatility, thanks largely to faltering stock prices of U.S. hyperscalers. A recovery in the AI trade, driven by hyperscaler cold hard cash (flow), may be required before US stocks can rise back into their longer-term leadership position.
Hyperscalers Alphabet, Amazon, Meta, Microsoft and Oracle are the primary backbone and infrastructure providers of artificial intelligence. Once generally revered for their extraordinary cash “moats”, the race to build and deploy artificial intelligence has this group burning through cash and leaning into debt markets. That in turn has resulted in uncertainty regarding the companies’ collective ability to generate a return on these heavy investments. Thus, it will likely take a cash flow recovery to spark renewed optimism in the shares. With stronger than expected revenue growth and a slowdown in capital spending, Oracle may have set the stage for what it will take for hyperscalers to at least find a floor. To recover their hype, this group may need to show a whole lot more.
Hype Fade is a Big Drag on Stocks
Stocks of the five hyperscalers are down 9.3% as a group in 2026, with Oracle down most and Meta in line with the S&P 500. Only Alphabet has managed to outperform the index this year. Since these hyperscalers make up 18.5% of the S&P 500’s market capitalization, their lackluster performance has become a significant drag on index performance.
The Cash Moat Appears to be Crumbling
Earnings growth has slowed down a touch, but this is not likely the primary problem plaguing the group. In 2025, they managed to record 22% earnings growth, 1.6 times that of the S&P 500, and in the fourth quarter alone, the group still reported a 17.8% YoY gain, still stronger than index growth of 13%. However, this robust earnings growth has failed to support stock prices.
Fading momentum in earnings may be part of the reason stocks have struggled, but the even faster decline in free cash flow (FCF) is likely the bigger concern for the stock market. Free cash flow for this group is falling faster than it did even in the depths of the 2022 decline.
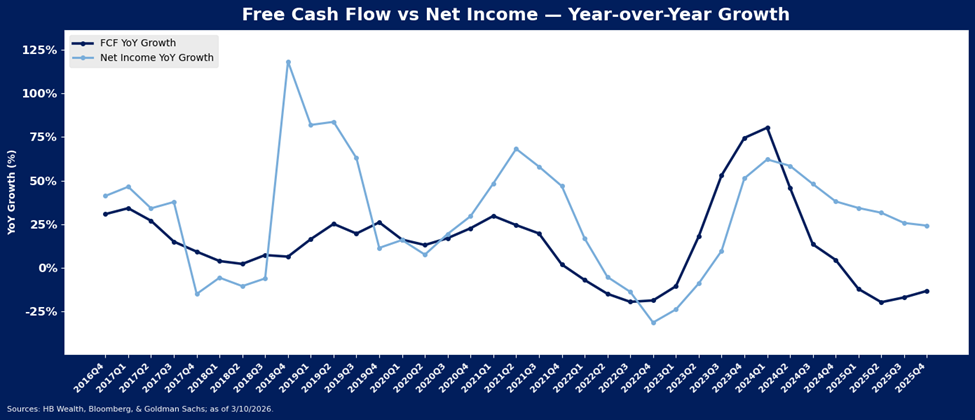
In the bigger picture, FCF has always been a key indicator of stock price performance for the group. Hyperscaler free cash flow hit a low in the fourth quarter of 2022, and recovery sparked a tremendous rally in share prices. Wobbles in the equities started to emerge after free cash flow peaked in mid-2024. The market detached from the FCF signal in the post-Liberation Day rebound euphoria, but Oracle’s free cash flow contraction in 2H 2025 brought the issue back to the forefront.
Oracle has gone from first to worst among hyperscaler stocks since its September peak, as the market has started to pay increasing attention to free cash flow (FCF) as the primary driver of equities. If Oracle manages to stabilize FCF, as indicated in their earnings release suggesting revenue is growing faster than expected as capital spending plans hold steady, this could go a long way toward helping the hyperscalers recover their hype. The remaining companies must follow suit.
That follow-through from the rest is still quite unclear. In aggregate, group FCF dropped 23.7% in 2025 from 2024, and three of the five hyperscalers recorded lower FCF last year compared to the prior year. While Oracle’s free cash situation may now be stabilizing, Amazon’s appears to be worsening.
Revenue Will Need to Emerge to Rebuild the Hype
Earnings trends are not currently making the case for an imminent turnaround in the cash flow situation. That will require much stronger than expected revenue growth and perhaps even a slowdown in the rate of growth of capital spending. Earnings growth is expected to continue to slow to 17.4% in 2026, still stronger but just barely by comparison to the 15.2% growth rate expected for the S&P 500. For the year ahead, the market is forecasting revenue growth of 16.5% for the group, compared to 14% in 2025 and 18% in 2024. Capex rose about 70% last year, significantly outpacing revenue growth. The group is still anticipated to spend about $650 billion this year, representing growth of 40%.
Valuations add a final leg of risk, as unfortunately, even after the poor performance this year, the market is still paying a fairly high price for increasingly limited cash flows. Four of the five hyperscalers still have a lower FCF yield than they did in 2024 and three have a lower yield than their 5-year average. Free cash flow for the group is at a level last recorded in September 2023, while stock prices are 63.4% higher than that point. Free cash flow yield for Oracle is negative, flat for Amazon and between 2-3 percent for the rest.
With valuations still somewhat elevated, the market’s focus will likely remain on cash flow, and the degree to which capex intensity translates into revenue growth in coming years. Currently the rate of revenue growth anticipated by the consensus is still short of growth recorded even two years ago, and capex intensity remains a challenge. Due to the size of the hyperscalers, their impact on the U.S. equity market at large will remain significant, and since cash flow is a primary driver of hyperscaler stocks, it is also likely to remain a driver of US equity market performance at large.
Disclosure: HB Wealth is an SEC registered investment adviser. The information reflects the author’s views, opinions, and analyses as the publication date. The information is provided for informational purposes only and does not constitute an offer to sell or a solicitation of an offer to buy any investment product. This information contains forward-looking statements, predictions, and forecasts (“forward-looking statements”) concerning the belief and opinions in respect to the future. Forward-looking statements involve risks and uncertainties, and undue reliance should not be placed on them. There can be no assurance that forward-looking statements will prove to be accurate, and actual results and future events could differ materially from those anticipated in such statements. The information does not represent legal, tax, accounting, or investment advice; recipients should consult their respective advisors regarding such matters. Certain information herein is based on third-party sources believed to be reliable, but which have not been independently verified. Past performance is not a guarantee or indicator of future results; inherent in any investment is the risk of loss.

