








Sector dispersion – measured by the difference between the best and worst performing sectors – has been notably tight relative to longer term norms in 2026 as the rising economic tide may be lifting most “boats” in the equity market. Tight dispersion normally occurs in the early to middle stages of a cyclical recovery and dispersion rises near the end of cycles, so this year’s low dispersion could throw a bit of cold water on any thesis that suggests the economic cycle is in its advanced stages. Nonetheless, the 21.5 percentage point gap between the top and bottom performing sectors is more than double the return for the broad market so far this year, showing there remains considerable portfolio benefit from sector strategy. Even at its slimmest in history, dispersion was 12.3 percentage points over six months, and on average, nearly half of sectors outperform the index in a given half-year.
Tight Sector Dispersion is Typical of Recoveries
The S&P 500 is experiencing notably narrow sector dispersion this year – a backdrop that is more typical of early to mid-cycle than late-stage economic recoveries.
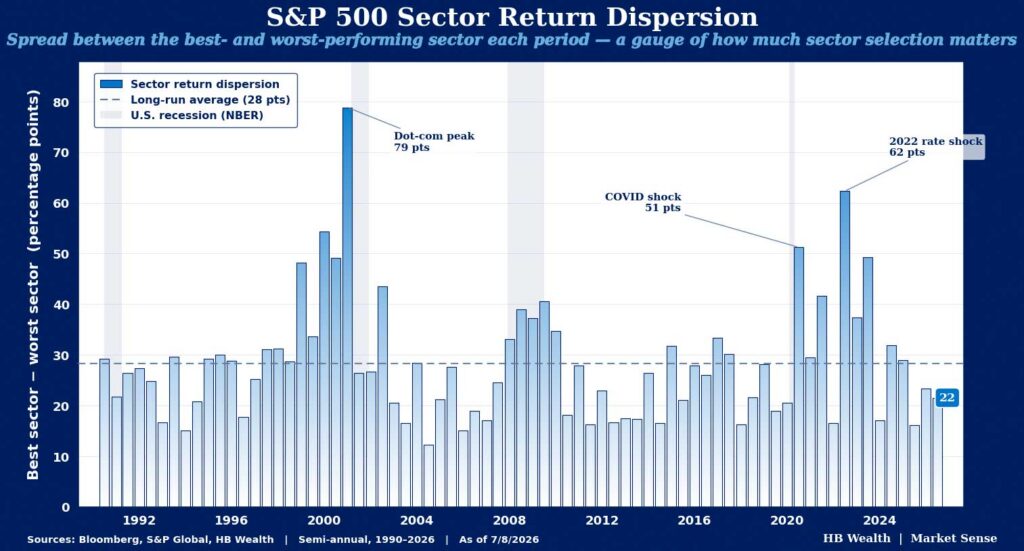
In 1H26, the spread between the best performing S&P 500 sector and the worst was 21.5 percentage points. On a semiannual basis going back to 1990, that is the 25th smallest dispersion on record. The index gained 5% on average and rose 85.2% of the time when the gap between sector winners and losers was at least this narrow. Most observations where dispersion was similarly tight occurred during periods of early cycle economic recovery and rebounds off correction lows, with half-years during the early 1990s, just after the Tech Bubble and Great Financial Crisis, 2021, and 2023-24 making up the bulk of instances. In contrast, sector dispersion is persistently higher around economic cycle peaks with the dot-com bubble posting the highest spread on record. Interestingly, despite the tight dispersion, 45.5% (5 of 11) sectors beat the index in 1H, reflecting improving sentiment that carried all but the discretionary and financials sectors to gains.
Gap Between Sector Winners and Losers Still Makes Case for Sector Strategy
The 21.5 percentage point gap between the best and worst performing sectors so far this year shows how sector selection still adds value, even in a market where a rising tide is lifting most boats. Historically, there is a persistent gap between sector winners and losers and near coin-flip chances of selecting a group that will outperform large and small cap benchmarks. On average, there’s a 28.3 percentage point spread between S&P 500 sector out- and under-performers (semiannually, back to 1990), and even at its slimmest (12.3 percentage point gap), dispersion offered significant leeway for active strategies. Likewise, nearly half of sectors (47.1%) outperform the S&P 500 on average on a semiannual basis, making it a near coin-flip that managers with no information would land on an outperforming group.
Disclosure: HB Wealth is an SECregistered investment adviser. The information reflects the author’s views, opinions, and analyses as the publication date. The information is provided for informational purposes only and does not constitute an offer to sell or a solicitation of an offer to buy any investment product. This information contains forward-looking statements, predictions, and forecasts (“forward-looking statements”) concerning the belief and opinions in respect to the future. Forward-looking statements involve risks and uncertainties, and undue reliance should not be placed on them. There can be no assurance that forward-looking statements will prove to be accurate, and actual results and future events could differ materially from those anticipated in such statements. The information does not represent legal, tax, accounting, or investment advice; recipients should consult their respective advisors regarding such matters. Certain information herein is based on third-party sources believed to be reliable, but which have not been independently verified. Past performance is not a guarantee or indicator of future results; inherent in any investment is the risk of loss.