








- Financial conditions are easier than any point since early 2022, more than a standard deviation easier than long term average and at a level that has historically often resulted in tighter monetary policy.
- Meanwhile, the Taylor rule, which assesses the current combination of growth and inflation, suggests the Fed funds rate is too low.
- This combination supports the Fed’s hawkish shift and may imply a higher likelihood of policy tightening later this year.
- A change in monetary policy may spark more volatility and short-term weakness in stocks but does not necessarily imply major strain unless higher rates materially slow down growth.
The Fed’s recent shift toward a more hawkish bias has merit, according to measures of financial conditions as well as economic performance. Financial conditions are easier than any point since early 2022, boosted by ebullient equity markets, and the current combination of growth and inflation suggests the Fed funds rate may be as much as 300 basis points too loose. If the ultimate result is a tightening in policy, this may create a short-term disruption for equities. However, history suggests that disruption will only morph into a deeper downturn if Fed tightening goes so far as to materially slow down the rate of growth in the economy and earnings.
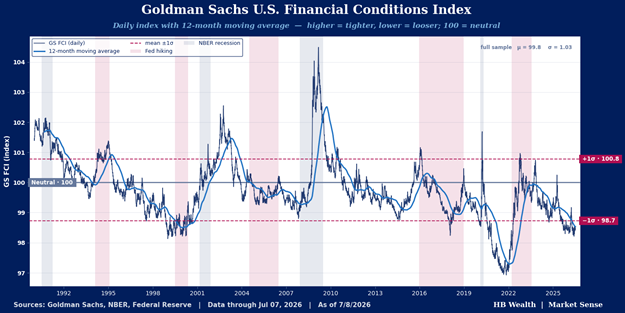
Easiest Conditions Since 2021 Justify Hawks, May Warrant A Hike
The Goldman Sachs US financial conditions index – a weighted composite of interest rates, credit spreads, equity prices, and exchange rates – suggests US financial conditions are currently extremely easy. The reading is at its lowest level since early 2022 – before rate hikes and quantitative tightening had just begun – and nearly the least restrictive since 2009. Thanks primarily to surging equities, low short-term rates and tight credit spreads, the index currently rivals some of the easiest conditions of the post-Great Financial Crisis period and is 1.2 standard deviations below long-term average.
Fed cuts amidst supportive financial conditions are historically rare, and easy financial conditions have more often led to tighter monetary policy. In 2014, conditions were similarly loose and the Federal Reserve stopped adding to its balance sheet in October before embarking on a hiking and quantitative tightening cycle. Likewise, conditions were slightly easier in 2021-22, when massive monetary stimulus helped fuel the inflation surge that forced the Fed to hike rates and quantitatively tighten that year. Broadly since 1990, the Fed has cut rates in only 4 instances when financial conditions were already one standard deviation easier than average. Most of those cuts occurred in the lead up to the dot-com bubble, helping to fuel climbing asset prices in the mid-to-late 1990s.
Economy Also Validates Hawkish Tone
Meanwhile, the run rate of inflation and economic growth also supports a more hawkish tilt at the Fed. The Taylor rule provides a systematic, transparent framework for policy, determined by deviations in output and inflation from potential and target, respectively. It currently suggests that inflation is running 1.4% above target while GDP is running 1.1% above potential, resulting in a recommended policy rate level of 6.7% versus the current Fed funds rate of 3.63%. Even based on consensus expectations for cooler inflation and steady GDP in 2027, the Taylor rule recommends a policy rate of 5.5% – still well north of the current Fed funds rate of 3.75%.
Stocks generally perform better when the Fed is accommodative based on this rule than when the Fed is “tight”. However, there are points in time when the Fed gets “too easy” according to the rule, and these usually result in at least short-term trouble for markets. On average, when the policy rate was below the Taylor rule since 2000, it sat 236 basis points below that rate. When the spread exceeded 400 basis points, forward 12-month returns average just 4% and are negative nearly half the time. The current spread of 317 bps is above average but not quite to the 400 bps level that suggests trouble may be lurking.
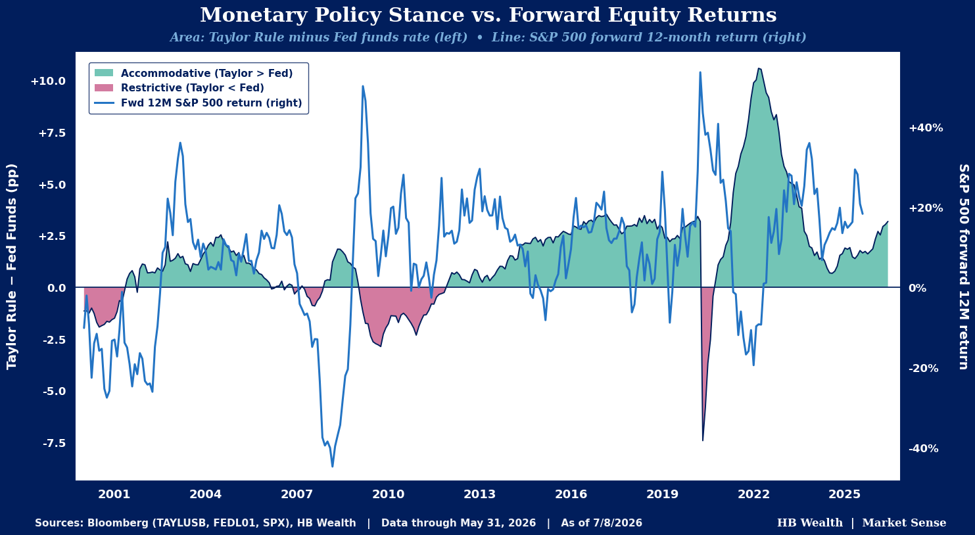
A Fed Hike May Trigger Volatility, But Not Necessarily Major Weakness
If the Fed starts to hike rates to tighten financial conditions toward neutral and align policy closer to that prescribed by the Taylor rule, a period of indigestion may emerge for risk assets. The risk of a 10%+ drawdown in stocks is somewhat higher when the Fed is more active versus periods when Fed policy is stable, historically, and average monthly returns are lower when the Fed is active than passive. However, a hiking Fed is not necessarily a trigger for major trouble unless the hikes result in significant slowdown in economic and earnings growth.
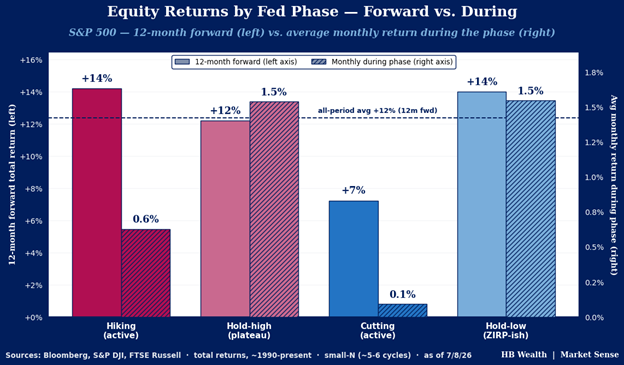
Equity returns during hiking and cutting cycles are mixed through history, but the S&P 500 tends to do best when rates are stable. On average, stocks’ 12 month forward returns averaged 15% in periods with lower-for-longer rates and averaged 12% gains when the Fed was holding rates at higher levels. Average monthly returns during these periods of rate stability are much stronger, at 1.5%, than average monthly returns when the Fed is actively hiking (0.6%) or cutting (0.1%).
While the average monthly returns during hiking phases are lower than when the Fed is holding rates steady, forward 12 month returns during hiking phases are on average still quite strong. This suggests any policy-related volatility is most likely to be somewhat temporary.
The phenomenon of steady forward 12-month returns during hiking phases is also partly a reflection of cycle timing. Half of the hiking cycles since 1990 have captured the last gasps of major equity run-ups like 1999-2000 and 2007, resulting in above-average forward 12-month returns of 14%. Timing also largely explains why market performance is so poor during active rate cutting cycles. Five of seven cutting cycles have been affiliated with double-digit drawdowns in stocks, averaging a 25% peak-to-trough decline, likely because those cuts cluster in recessions.
Disclosure: HB Wealth is an SECregistered investment adviser. The information reflects the author’s views, opinions, and analyses as the publication date. The information is provided for informational purposes only and does not constitute an offer to sell or a solicitation of an offer to buy any investment product. This information contains forward-looking statements, predictions, and forecasts (“forward-looking statements”) concerning the belief and opinions in respect to the future. Forward-looking statements involve risks and uncertainties, and undue reliance should not be placed on them. There can be no assurance that forward-looking statements will prove to be accurate, and actual results and future events could differ materially from those anticipated in such statements. The information does not represent legal, tax, accounting, or investment advice; recipients should consult their respective advisors regarding such matters. Certain information herein is based on third-party sources believed to be reliable, but which have not been independently verified. Past performance is not a guarantee or indicator of future results; inherent in any investment is the risk of loss.