


Lessons from the internet buildout at the turn of the century and productivity boom in the 1960s can offer perspective on what to expect for the economy and markets as AI deployment accelerates in the years to come.
Productivity expansions in 1961-1968 and 1998-2005 are the longest and strongest in US history and show the impact of innovation cycles on economic conditions. Both periods turned in 8+ years of above average productivity growth, setting a precedent for what to expect from the AI rollout.
The turn-of-the-century implementation of internet technology meant significant job losses for tech and adjacent industries, but limited job losses in the economy at large. So far, the AI-rollout is following an eerily similar playbook.
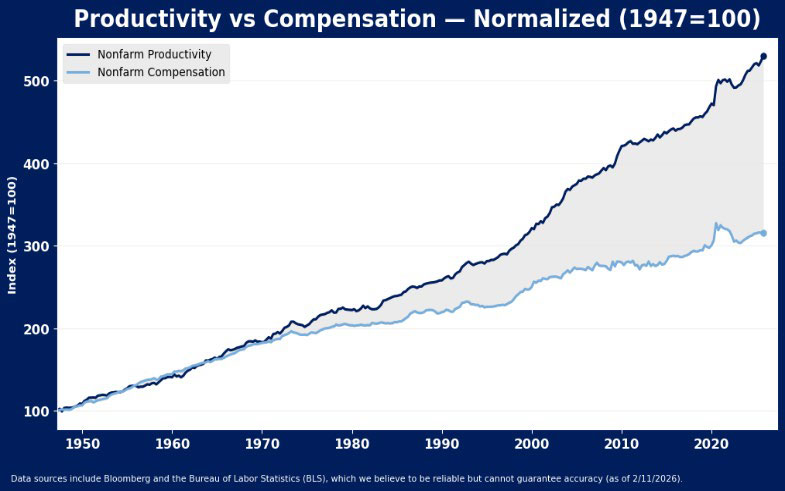
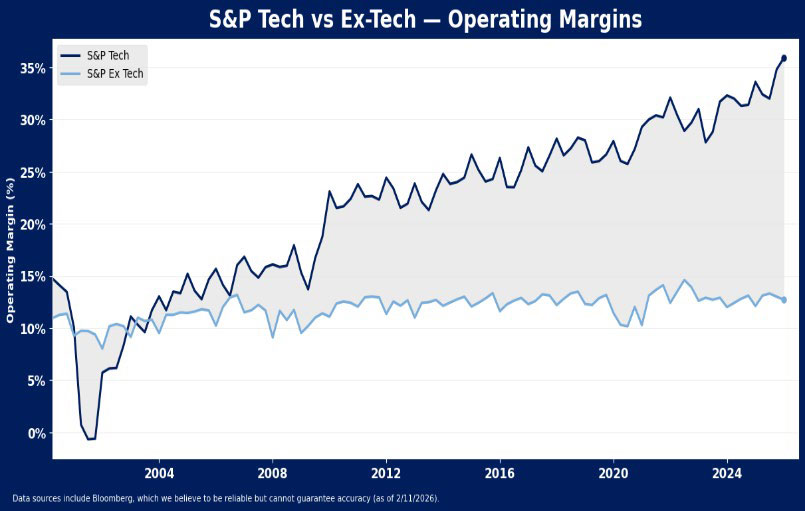
Productivity improvements in the 90s did not, however, result in widespread profitability gains for US companies. Margin gains have been largely limited to the tech sector for most of the last 25 years.
Both productivity booms surprisingly were affiliated with slightly below average annual returns to stocks with significant swings in sentiment evident.
AI May Boost Productivity, But Will it Boost Profitability?
Three key questions are often asked with respect to the economic and market impact of AI. First, will it result in a productivity boom for the economy? Second, what will it mean for jobs? And, finally, will it result in profitability gains for U.S. companies? Luckily, we have a recent precedent for how a major technological advancement paired with an investment boom played out for the markets and economy. Lessons from the internet buildout may not offer a precise playbook for what do expect from widespread AI-deployment, but they are worth exploring. The turn-of-the-century implementation of internet technology did improve productivity, but that gain was not met with widespread profitability gains for US companies. It meant significant job losses for tech and adjacent industries, but limited job losses in the economy at large. So far, the AI-rollout is following an eerily similar playbook.
Productivity Should Rise. How Much and Who Benefits is the Question.
There is a lot of hope for artificial intelligence to lift productivity of the US economy, as set by the precedent of past innovation cycles. Productivity growth averaged just 2.6% during the 90s decade – only slightly faster than long term average of 2.1% growth since 1960, and 2.4% growth in periods outside of economic recession. But once innovation permeated the economy, productivity growth was above average for the longest stretch in post WWII history. U.S. productivity rose from 0.44% at its low in December 1995 to 3.9% by March 2004, on a rolling 3-year annualized basis, and accelerated at a faster than average pace for 8.5 years (June 1998 to September 2006), the longest stretch of above average growth on record. The productivity boom just edged out the 1961-1968 period, when average productivity growth was above norm for 8 years.
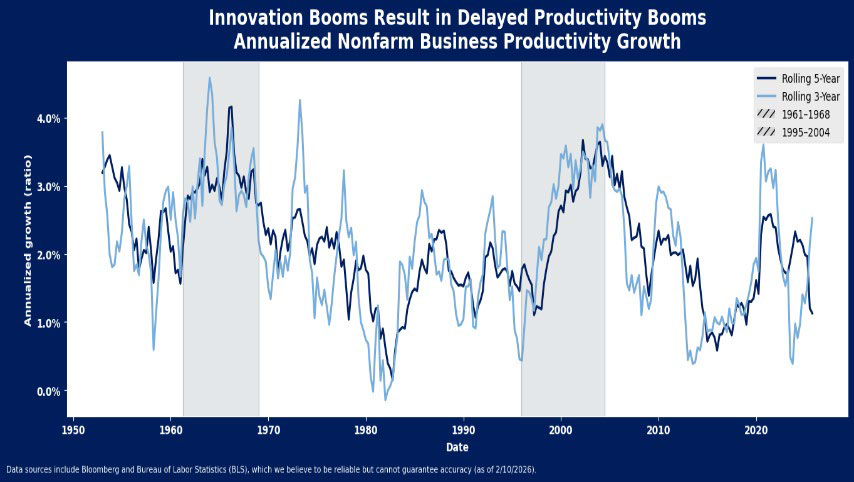
Perhaps the same extended period of productivity growth can be expected as artificial intelligence is increasingly utilized by US businesses. Productivity gains have been limited in recent years, and still pale in comparison to the late 90s, but AI-deployment is just getting started, leaving room for continued gains to emerge. In the last two reported quarters, US productivity has jumped at seasonally adjusted annual rates of 4.1% and 4.9%, respectively, much faster than long term annual rate of 2.2%. Rolling 3-year annualized productivity growth has hooked higher, up from its decade-low in March 2024.
What About Jobs?
Notably, internet proliferation negatively impacted job growth in the sector that developed and deployed the technology more than it hampered other groups. Tech, media and telecom industries lost nearly 1 million jobs from the March 2001 peak until April 2004, starting out at 3% of total nonfarm employment, and shrinking to 2.3%. Outside of the TMT segment, job losses were more limited, down 1%, from 132,751 to 131,412 thousand employed during the period.
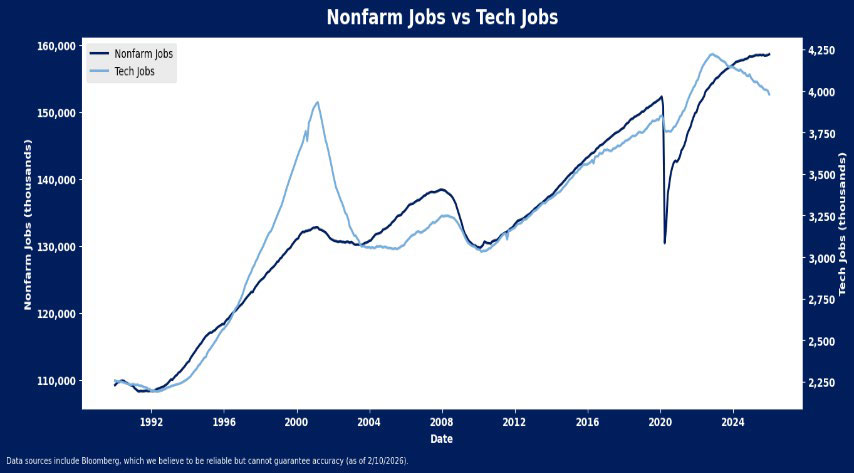
The job market is so far following a very similar path with AI deployment. Since the sector’s peak in December 2022, tech and tech-related employment has dropped 5.7%, the single fastest decline among private sectors. Broader employment is still rising, albeit slowly, but the result is tech laborers comprise 2.5% of total US nonfarm employment, down from their peak of 3% in March 2001.
Productivity Gains Aided Tech Sector Profitability Most
Assuming AI-proliferation results in another long-term rise in productivity akin to the 1960s or 1990s, a key question remains whether it will result in profitability improvements for the equity market at large. The long-term impact of the productivity boom and sharp job loss in the tech sector was a margin boost that endured almost exclusively for technology companies. That gain was not replicated in the rest of the index, where margins rose only modestly.
Operating margins for S&P 500 technology companies rose from 10% in 2000 (the start of our data series) to 15.7% in 2005, while margins for non-tech companies rose from 9.3% to 10.2% over that same time. This phenomenon of tech margin growth only accelerated over the last twenty years, as tech margins touched 35.9% last year, more than 2X, or 20.2 percentage points, above the level 20 years prior. Non-tech margins meanwhile were just 12.7%, or approximately 250 basis points above their 2005 level. So even as economic productivity rose, the tech sector was the primary profitability beneficiary.
Conclusion
If the turn of the century internet deployment turns out to be a guide as to what to expect from deployment of AI, fears of widespread job losses may also prove unfound, even if tech sector job growth may remain a center of weakness. We can also likely anticipate the economy will enjoy a rising tide of productivity, but that productivity may not lift all corporate boats, as the benefits of this latest technological innovation could remain strongest for the innovators themselves.
The lack of margin gain in non-tech S&P 500 companies over the last few decades is not necessarily a testament to the failure of technology to spark improvement, but it does offer a potential reality check on presumptions of future profitability from AI utilization. Likewise, the two productivity booms did not result in particularly robust market returns. Stocks averaged annual growth of 3.2% over the 8-year boom around the turn of the century and 7.5% in the 60s period. This compares to average annualized growth of 7.6% over all 8-year periods since 1950.

