LOGO BLUE
LOGO BLUE
  • About Us
    • The HB Wealth Story
    • Our Purpose
    • The HB Wealth Difference
      • Fee-Only Fiduciary Commitment
      • Credentialed Experts
      • Comprehensive Advice
      • Concierge-Level Care
      • Private Market Expertise
    • Community
    • Cultural Commitment
    • Awards and Recognition
  • Our Services
    • Wealth Advisory Services
      • Financial Planning
      • Executive Financial Planning
      • Multi-Generational Planning
      • Estate Planning Services
      • Tax Planning Services
      • Interactive Planning
      • Wealth Forecast
      • Retirement Planning Services
      • Insurance Planning
      • Administrative Services
      • Charitable Planning
      • Education Planning
    • Investment Management
      • Private Market Investments 
      • Key Investment Principles
      • Online Reporting
      • Our Investment Process
      • Our Investment Expertise
      • Investment Communication
      • Investment Risk Management
    • Family Office Services
    • Service Levels and Costs
  • Who We Serve
        • Individuals and Families
          Business Owners and Entrepreneurs
          Corporate Executives
          Professional Service Practitioners
          Female Wealth Creators
          Suddenly Single Individuals
          Multi-Generational Families
          Institutions
          Individuals and Families
          Individuals and Families

          We are privileged to serve families across 48 states with their wealth management needs including comprehensive advice, financial planning, and investment management, all with a mission of providing unwavering financial peace of mind.*

          *As of December 31, 2025

          See How We Help Individuals and Families
          A smiling family of four poses outdoors on a sunny day. The father has a child on his shoulders, while the mother and another child stand close, all looking happy with trees and blue sky in the background.
          Business Owners and Entrepreneurs
          Business Owners and Entrepreneurs

          We work with successful business owners to help them navigate pre-sale planning, post-sale investing, asset protection, charitable giving, and long-term wealth forecasting to align financial strategies with lifestyle goals.

          See How We Help Business Owners and Entrepreneurs
          A middle-aged man with gray hair and a beard, wearing a light plaid shirt and beige pants, stands smiling with arms crossed in front of a glass door and bookshelves in a cozy, well-lit shop or library.
          Corporate Executives
          Corporate Executives

          We develop custom strategies for executives with concentrated stock and options complexities, including tax planning, cash-flow modeling, executive benefit optimization, retirement planning, and advisor coordination to free up time while aligning corporate and personal goals.

          See How We Help Corporate Executives
          Confident older woman with gray hair wearing a light-colored blazer and blouse, standing with arms crossed and smiling in a modern office environment with glass walls.
          Professional Service Practitioners
          Professional Service Practitioners

          We assist attorneys, physicians, consultants, CPAs, and other professionals with ongoing wealth planning, creating customized portfolios, and coordinating with trusted advisors to navigate and manage complex wealth and professional transitions.

          See How We Help Professional Service Practitioners
          A smiling man in a blue blazer and beige pants sits on a desk with his arms crossed in a modern office, with shelves of binders and a laptop visible in the background.
          Female Wealth Creators
          Female Wealth Creators

          We support women building and managing wealth with personalized planning, tailored investment strategies, coordinated tax and retirement guidance, and long-term legacy planning designed to reflect their goals and values.

          See How We Help Female Wealth Creators
          A woman with long blonde hair, wearing a sleeveless black dress, sits on a light grey armchair in a bright room with large windows and white curtains, smiling softly at the camera.
          Suddenly Single Individuals
          Suddenly Single Individuals

          We support individuals navigating divorce or loss by organizing finances, setting goals, building advisor teams, reviewing legal documents, and fostering connections to offer clarity and community amidst major life transitions.

          See How We Help Suddenly Single Individuals
          A woman with short dark hair, wearing a white button-up shirt and a black necklace, sits on a gray couch against a plain light-colored wall, smiling gently at the camera.
          Multi-Generational Families
          Multi-Generational Families

          Our multi-generational family office services extend beyond planning and investing to include consolidated reporting, entity structuring, administrative support, family education, insurance reviews, and independent due diligence tailored to each family’s unique needs.

          See How We Help Multi-Generational Families
          Three generations of a smiling family—grandparents, parents, and two children—stand together with arms around each other in a sunny park, with a fluffy white dog sitting in front on the grass.
          Institutions
          Institutions

          We provide tailored investment management services to select corporations, endowments, foundations, and nonprofits through an Outsourced Chief Investment Officer (OCIO) model designed to alleviate ongoing investment management tasks so your team can focus on fulfilling your organization’s mission.

          See How We Help Institutions
          A confident older woman in business attire stands smiling with arms crossed in front of a diverse group of four professionally dressed colleagues, all smiling and standing in a bright office setting.
        • Individuals and Families
        • Business Owners and Entrepreneurs
        • Corporate Executives
        • Professional Service Practitioners
        • Female Wealth Creators
        • Suddenly Single Individuals
        • Multi-Generational Families
        • Institutions
  • Meet The Team
    • Wealth Advisors
    • Client Service
    • Investments
    • Leadership
    • Business Operations
  • Our Offices
    • Atlanta, GA
    • Alpharetta, GA
    • Augusta, GA
    • Sandy Springs, GA
    • Palm Beach, FL
    • Tampa, FL
    • Towson, MD
    • Columbia, MD
    • Charlotte, NC
    • Columbia, SC
    • Greenville, SC
    • Nashville, TN
  • Insights and News
    • Blog & Market Commentary
    • Helpful Resources
      • How to Select an Advisor
      • Understanding Family Offices
    • HB Wealth in the News
    • Market Sense
  • Careers
  • Request a Consultation
  • Client Login
LOGO BLUE

Market Sense

Market Sense

  • Home
  • Insights and News
  • Market Sense

By:

A woman with long brown hair wearing a blue blazer and a necklace smiles at the camera. The background is softly blurred with light and blue tones.
Gina Martin Adams, CFA, CMT
Chief Market Strategist, Shareholder
A young man with short brown hair, wearing a dark suit, white shirt, and blue tie, stands in front of a blurred background with lights and blue tones.
Matthew Sanders
Senior Investment Research Analyst
A smiling man in a blue suit, white shirt, and blue tie stands in front of a blurred, modern indoor background with circular lights.
Michael Casper, CFA
Director, Senior Market Strategist
December 2, 2025

Can Stocks Defy Gravity in 2026? – Part 2

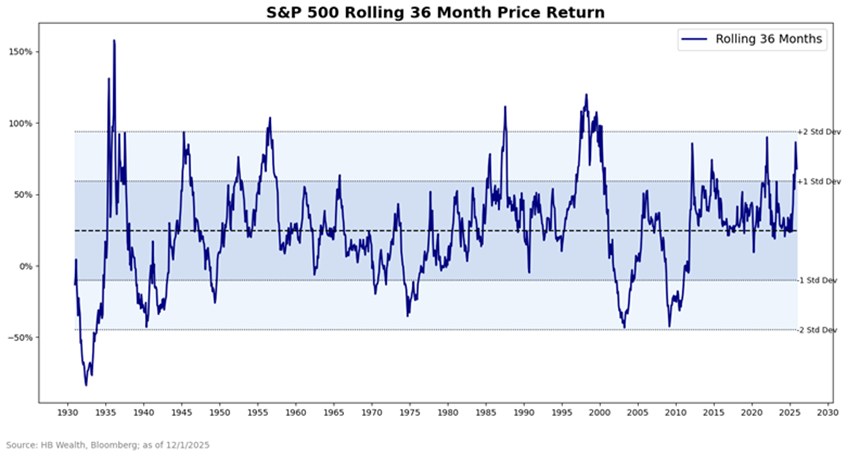
The S&P 500’s 36-Month Rolling Return neared 2 standard deviations from norm in September. The chart below shows what historically happened after extremes were reached in the measure. The more extreme the deviation, the lower the return prospects. Likewise, such extreme deviations above norm generally lower the probability of a…

Read More

Bar chart showing S&P 500 forward 12-month returns after extremes in 36-month rolling returns. Returns range from +26.1% at -2 std dev to -3.3% at +2 std dev, with both average and median forward returns shown.
December 2, 2025

Can Stocks Defy Gravity in 2026? – Part 1

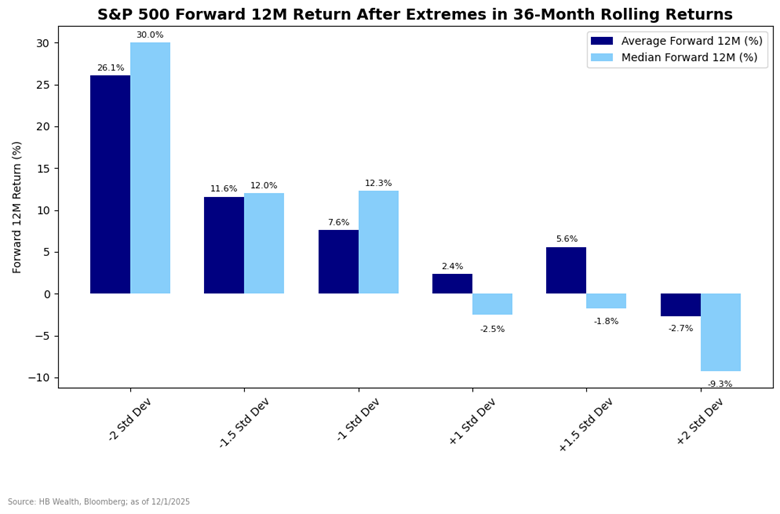
The annual prognostications for equity market returns are rolling out as the end of the year approaches, and the current strategist consensus suggests a moderate 5% return is likely. Historical patterns support these low expectations, for the S&P 500 has crossed a critical threshold that implies a strong likelihood of…

Read More

Line chart of S&P 500 rolling 36-month price returns from 1930 to 2025, with returns ranging from below -50% to above 100%. Shaded bands show standard deviation levels around the mean return.
November 24, 2025

Consumer Expectations are High for 2026

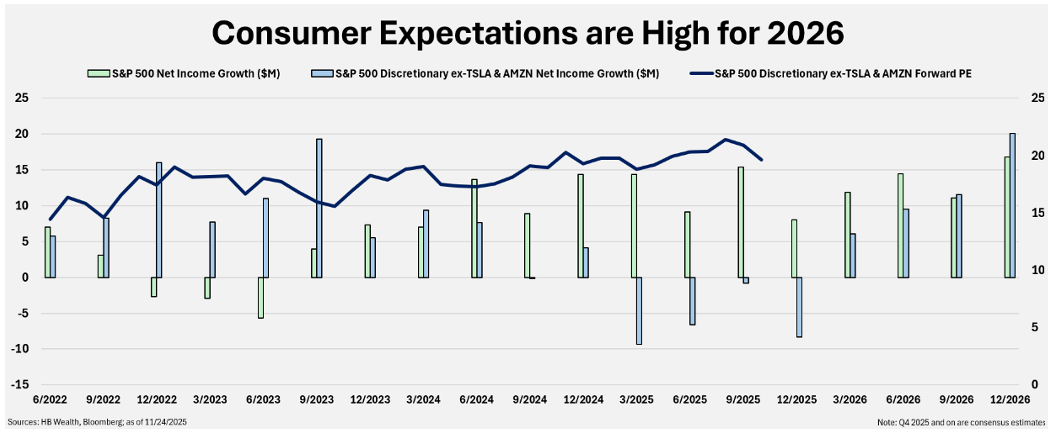
Thanksgiving week normally kicks off a period of positive seasonality in stocks, in part because the U.S. consumer rarely disappoints during the holiday season. But high market expectations for recovery in 2026 may be tough for the consumer to overcome in the year ahead. Consensus and market implied expectations for…

Read More

Bar and line chart titled Consumer Expectations are High for 2026, showing S&P 500 net income growth, S&P 500 discretionary net income growth (excluding TSLA & AMZN), and forward PE from 2022 to 2026.
November 24, 2025

Relative Outlook for Global Shares Remains Supportive 

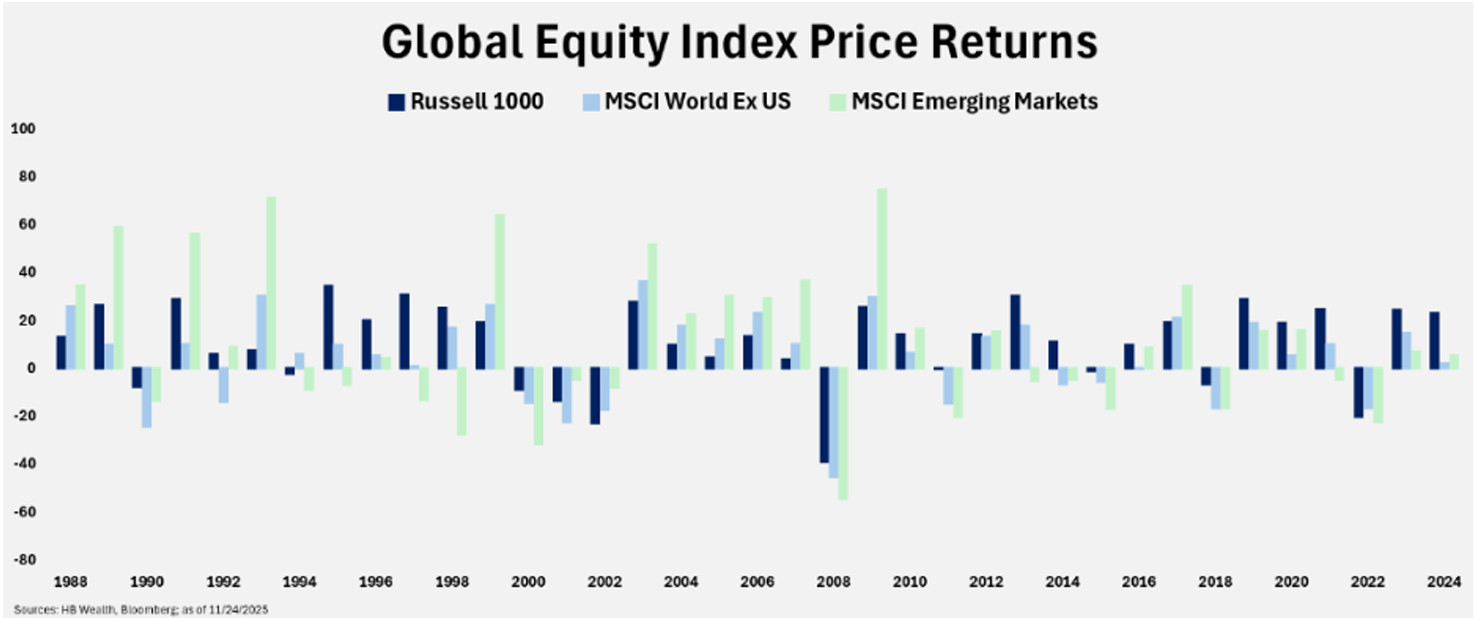
International stocks are on their way to their first year of outperforming domestic stocks since 2017, and strengthening earnings, discounted valuations, and dollar depreciation may all continue to make the case for global shares to perform well into 2026. U.S. stocks (represented by the Russell 1000) are up 13% so…

Read More

Bar chart showing annual price returns for Russell 1000, MSCI World Ex US, and MSCI Emerging Markets from 1988 to 2024. Returns vary year to year, with different indices outperforming in different years.
November 21, 2025

Jobs Market Continues to Signal Poor Economy

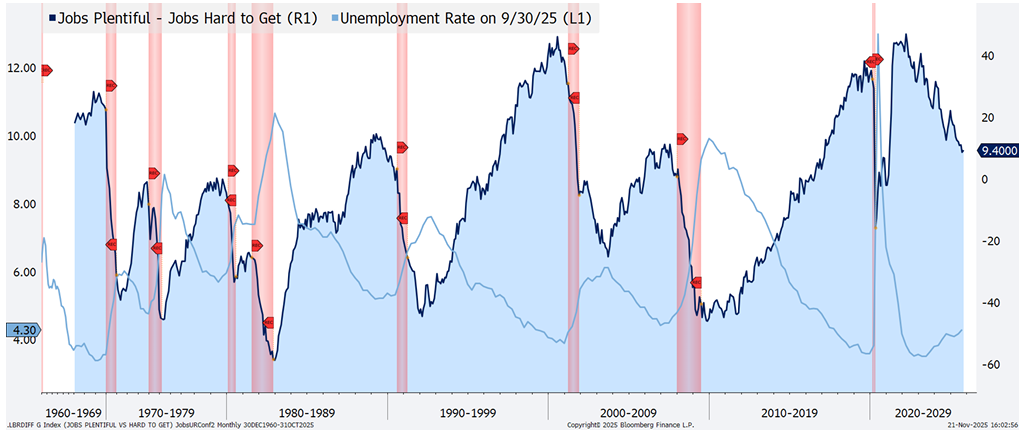
The jobs market has signaled a weak economy for years, even as other indicators such as corporate profits suggest the economy is holding up reasonably well. This may help explain why consumer confidence remains near record low levels, even as the stock market is at record highs. The unemployment rate…

Read More

Line graph showing U.S. jobs plentiful vs. jobs hard to get, unemployment rate, and recession periods (highlighted in red) from 1966 to 2025, with cyclical peaks and troughs evident in the data.
November 21, 2025

Market Technical Analysis

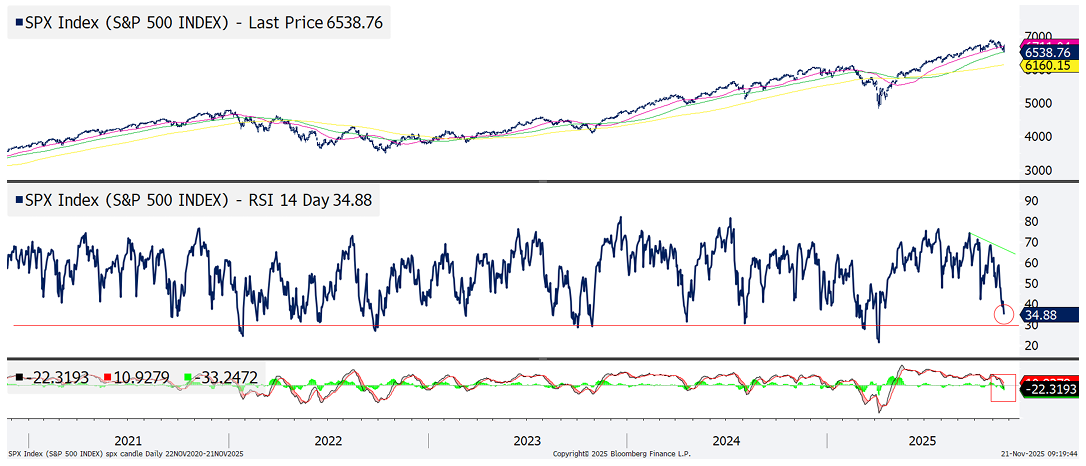
The longer-term equity bull market remains intact, supported by S&P 500 moving averages that are still trending higher, but stocks’ short term sell-off looks likely to deepen nonetheless. Momentum, represented by 14-day RSI, is not yet oversold and MACD (moving average convergence divergence) has just crossed into negative territory, hinting…

Read More

Line chart showing the S&P 500 Index price trend, 14-day RSI, and rate of change from 2021 to mid-2025. Price peaks and dips, RSI drops to 34.88, and the rate of change falls below zero, indicating recent downside momentum.
November 20, 2025

Are Stocks Anticipating Too Much From AI?

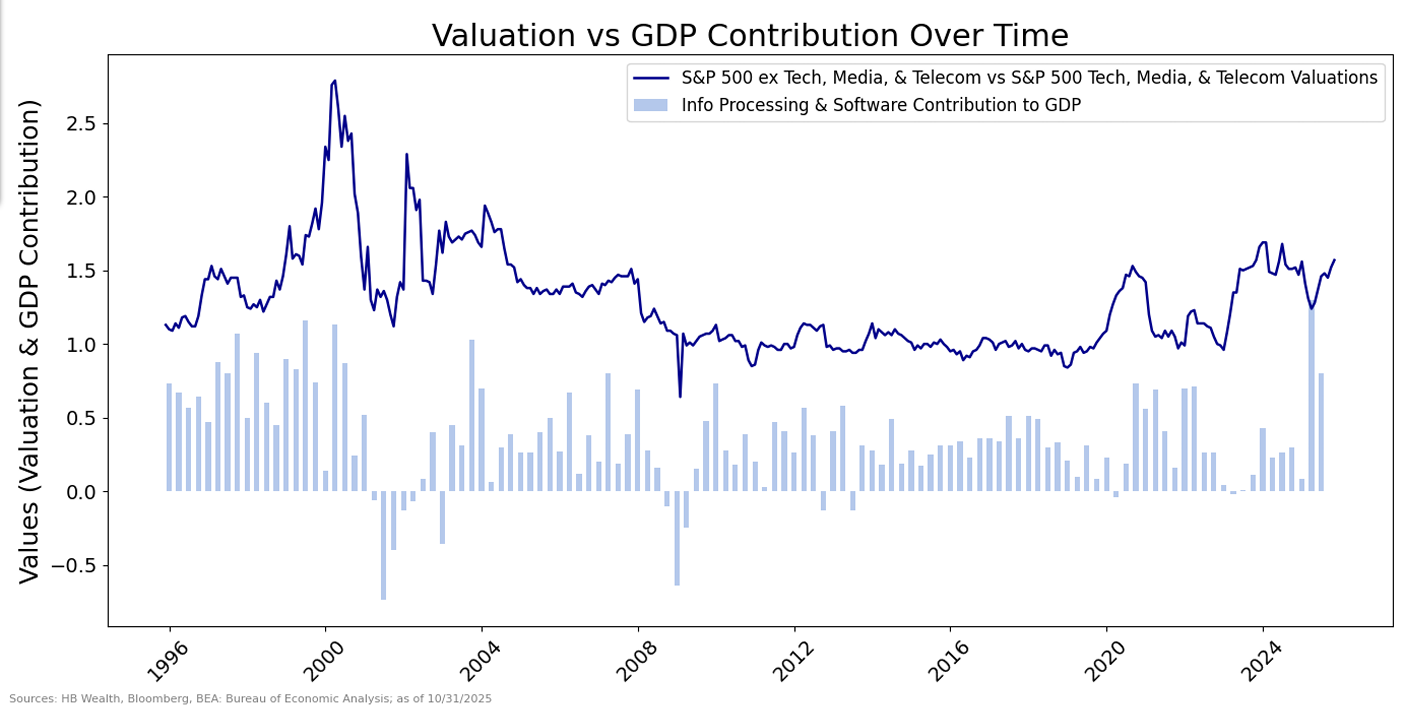
The equity market is enthusiastic about prospects for AI spending to remain a primary driver of earnings growth, and while a cooldown in valuations may be needed to keep expectations from getting too far detached from reality, both investment trends and stock multiples are less extreme than they were in…

Read More

Line graph comparing S&P 500 valuations (tech, media, telecom) with their GDP contribution from 1995 to 2024; shows fluctuating valuations and a steadier GDP contribution over time.
November 18, 2025

Bitcoin Weighs on Outlook for Tech

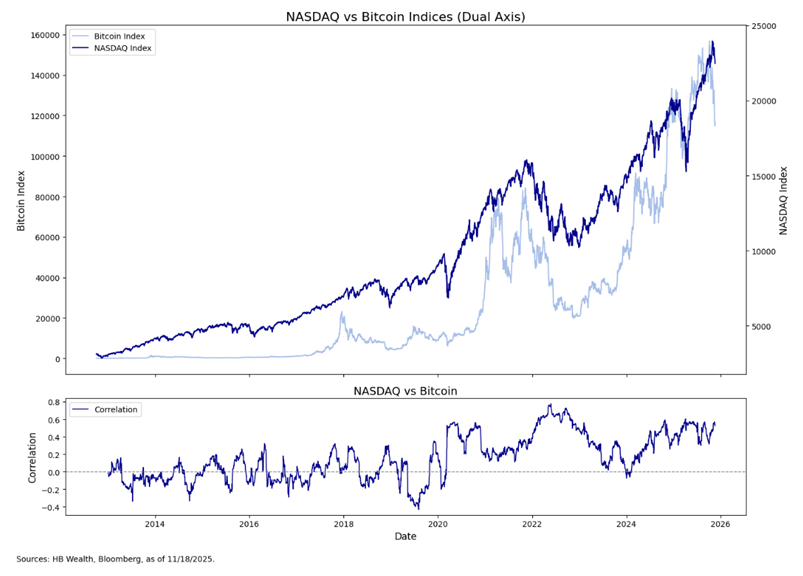
Bitcoin is down more than 25% from its peak in early-October, and this doesn’t bode well for U.S. tech stocks, which have dropped less than 6%. If past proves precedent, and unless Nvidia can revive confidence with their earnings report tomorrow, US tech could be due for a bigger decline…

Read More

Line chart comparing NASDAQ and Bitcoin indices from 2013 to 2026, showing Bitcoin’s rapid growth and volatility. Below, a graph displays the correlation between the two indices over time.
  • « Previous
  • 1
  • …
  • 3
  • 4
  • 5

Want To Learn More About HB Wealth?

Request a Consultation
HB_WEALTH_White.svg
Georgia

Atlanta (HQ)
Alpharetta
Augusta
Sandy Springs

Florida

Palm Beach
Tampa

Maryland

Columbia
Towson

North Carolina

Charlotte

South Carolina

Columbia
Greenville

Tennessee

Nashville

Facebook Twitter LinkedIn Instagram Youtube
  • © 2026 Copyright - HB Wealth
  • Privacy Policy & Disclosure
  • Form ADV
  • CRS
  • Contact Us