LOGO BLUE
LOGO BLUE
  • About Us
    • The HB Wealth Story
    • Our Purpose
    • The HB Wealth Difference
      • Fee-Only Fiduciary Commitment
      • Credentialed Experts
      • Comprehensive Advice
      • Concierge-Level Care
      • Private Market Expertise
    • Community
    • Cultural Commitment
    • Awards and Recognition
  • Our Services
    • Wealth Advisory Services
      • Financial Planning
      • Executive Financial Planning
      • Multi-Generational Planning
      • Estate Planning Services
      • Tax Planning Services
      • Interactive Planning
      • Wealth Forecast
      • Retirement Planning Services
      • Insurance Planning
      • Administrative Services
      • Charitable Planning
      • Education Planning
    • Investment Management
      • Private Market Investments 
      • Key Investment Principles
      • Online Reporting
      • Our Investment Process
      • Our Investment Expertise
      • Investment Communication
      • Investment Risk Management
    • Family Office Services
    • Service Levels and Costs
  • Who We Serve
        • Individuals and Families
          Business Owners and Entrepreneurs
          Corporate Executives
          Professional Service Practitioners
          Female Wealth Creators
          Suddenly Single Individuals
          Multi-Generational Families
          Institutions
          Individuals and Families
          Individuals and Families

          We are privileged to serve families across 48 states with their wealth management needs including comprehensive advice, financial planning, and investment management, all with a mission of providing unwavering financial peace of mind.*

          *As of December 31, 2025

          See How We Help Individuals and Families
          A smiling family of four poses outdoors on a sunny day. The father has a child on his shoulders, while the mother and another child stand close, all looking happy with trees and blue sky in the background.
          Business Owners and Entrepreneurs
          Business Owners and Entrepreneurs

          We work with successful business owners to help them navigate pre-sale planning, post-sale investing, asset protection, charitable giving, and long-term wealth forecasting to align financial strategies with lifestyle goals.

          See How We Help Business Owners and Entrepreneurs
          A middle-aged man with gray hair and a beard, wearing a light plaid shirt and beige pants, stands smiling with arms crossed in front of a glass door and bookshelves in a cozy, well-lit shop or library.
          Corporate Executives
          Corporate Executives

          We develop custom strategies for executives with concentrated stock and options complexities, including tax planning, cash-flow modeling, executive benefit optimization, retirement planning, and advisor coordination to free up time while aligning corporate and personal goals.

          See How We Help Corporate Executives
          Confident older woman with gray hair wearing a light-colored blazer and blouse, standing with arms crossed and smiling in a modern office environment with glass walls.
          Professional Service Practitioners
          Professional Service Practitioners

          We assist attorneys, physicians, consultants, CPAs, and other professionals with ongoing wealth planning, creating customized portfolios, and coordinating with trusted advisors to navigate and manage complex wealth and professional transitions.

          See How We Help Professional Service Practitioners
          A smiling man in a blue blazer and beige pants sits on a desk with his arms crossed in a modern office, with shelves of binders and a laptop visible in the background.
          Female Wealth Creators
          Female Wealth Creators

          We support women building and managing wealth with personalized planning, tailored investment strategies, coordinated tax and retirement guidance, and long-term legacy planning designed to reflect their goals and values.

          See How We Help Female Wealth Creators
          A woman with long blonde hair, wearing a sleeveless black dress, sits on a light grey armchair in a bright room with large windows and white curtains, smiling softly at the camera.
          Suddenly Single Individuals
          Suddenly Single Individuals

          We support individuals navigating divorce or loss by organizing finances, setting goals, building advisor teams, reviewing legal documents, and fostering connections to offer clarity and community amidst major life transitions.

          See How We Help Suddenly Single Individuals
          A woman with short dark hair, wearing a white button-up shirt and a black necklace, sits on a gray couch against a plain light-colored wall, smiling gently at the camera.
          Multi-Generational Families
          Multi-Generational Families

          Our multi-generational family office services extend beyond planning and investing to include consolidated reporting, entity structuring, administrative support, family education, insurance reviews, and independent due diligence tailored to each family’s unique needs.

          See How We Help Multi-Generational Families
          Three generations of a smiling family—grandparents, parents, and two children—stand together with arms around each other in a sunny park, with a fluffy white dog sitting in front on the grass.
          Institutions
          Institutions

          We provide tailored investment management services to select corporations, endowments, foundations, and nonprofits through an Outsourced Chief Investment Officer (OCIO) model designed to alleviate ongoing investment management tasks so your team can focus on fulfilling your organization’s mission.

          See How We Help Institutions
          A confident older woman in business attire stands smiling with arms crossed in front of a diverse group of four professionally dressed colleagues, all smiling and standing in a bright office setting.
        • Individuals and Families
        • Business Owners and Entrepreneurs
        • Corporate Executives
        • Professional Service Practitioners
        • Female Wealth Creators
        • Suddenly Single Individuals
        • Multi-Generational Families
        • Institutions
  • Meet The Team
    • Wealth Advisors
    • Client Service
    • Investments
    • Leadership
    • Business Operations
  • Our Offices
    • Atlanta, GA
    • Alpharetta, GA
    • Augusta, GA
    • Sandy Springs, GA
    • Palm Beach, FL
    • Tampa, FL
    • Towson, MD
    • Columbia, MD
    • Charlotte, NC
    • Columbia, SC
    • Greenville, SC
    • Nashville, TN
  • Insights and News
    • Blog & Market Commentary
    • Helpful Resources
      • How to Select an Advisor
      • Understanding Family Offices
    • HB Wealth in the News
    • Market Sense
  • Careers
  • Request a Consultation
  • Client Login
LOGO BLUE

Market Sense

Market Sense

  • Home
  • Insights and News
  • Market Sense

By:

A woman with long brown hair wearing a blue blazer and a necklace smiles at the camera. The background is softly blurred with light and blue tones.
Gina Martin Adams, CFA, CMT
Chief Market Strategist, Shareholder
A young man with short brown hair, wearing a dark suit, white shirt, and blue tie, stands in front of a blurred background with lights and blue tones.
Matthew Sanders
Senior Investment Research Analyst
A smiling man in a blue suit, white shirt, and blue tie stands in front of a blurred, modern indoor background with circular lights.
Michael Casper, CFA
Director, Senior Market Strategist
February 18, 2026

U.S. Large Caps Have a Problem of Extraordinary Expectations

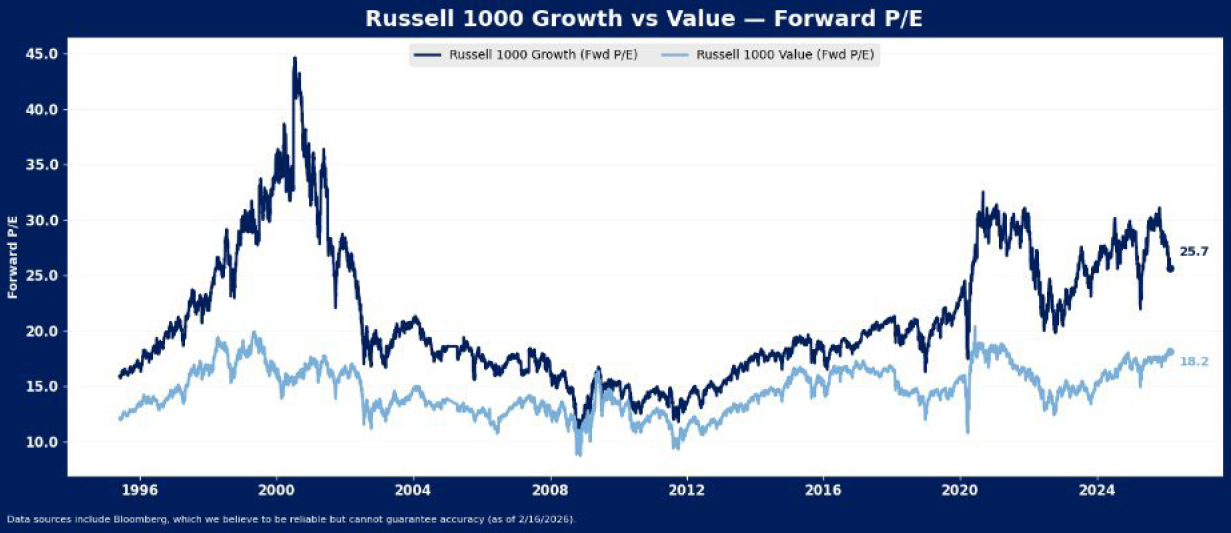
Recent rotation has helped resolve some of U.S. large cap stocks’ valuation excesses, but risks remain to the downside for U.S. multiples. Large cap growth’s sales multiple is still near its all-time high, at about 6X, and growth’s earnings multiple may still be at least 15% too rich to value….

Read More

Line chart comparing the Russell 1000 Growth and Value indices forward P/E ratios from 1996 to 2024. Growth peaks near 45 in 2000 and ends at 25.7; Value stays lower, ending at 18.2.
February 10, 2026

Growth Investing May Have Peaked with the Pandemic

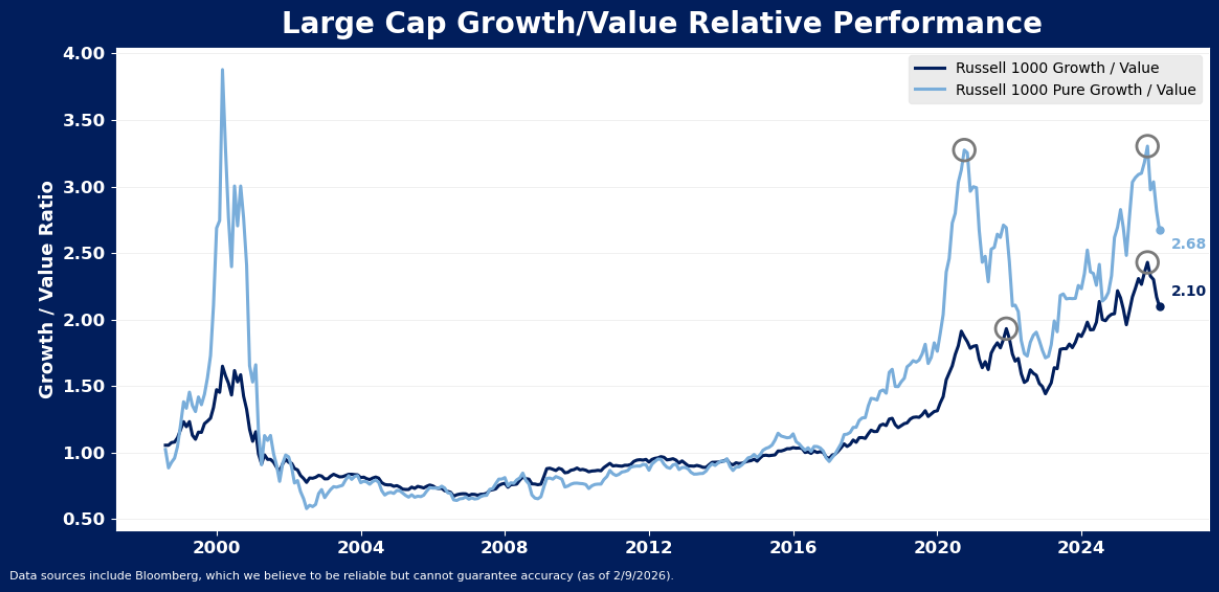
After outperforming for most of the last three years, growth stocks have been struggling relative to value stocks since October of last year. However, the broad indices may be masking a longer-term shift in the styles’ performance. Pure style indices and a look beyond large caps both suggest the growth…

Read More

Line chart showing the Russell 1000 Growth/Value and Pure Growth/Value ratios from 2000 to 2024, highlighting peaks around 2000, 2021, and 2024 with latest values at 2.10 and 2.68, respectively.
February 6, 2026

Don’t Ignore Inflation Risk in 2026

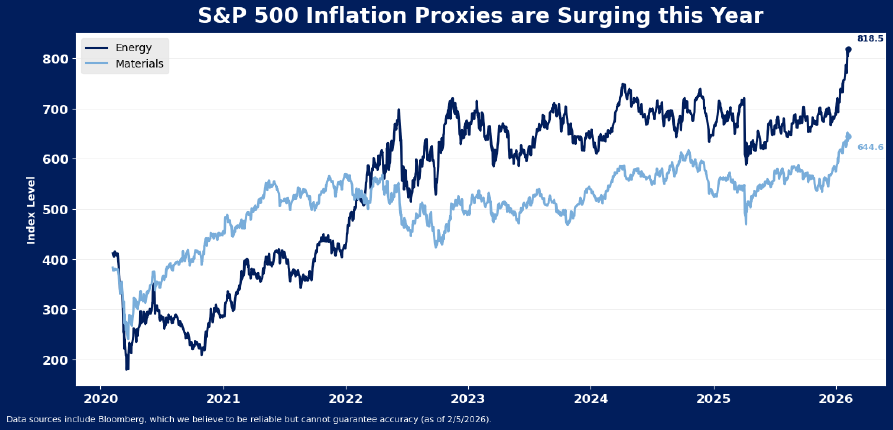
Elevated fiscal spending, easy monetary policy, trade tensions and geopolitical strains may imply inflation risk is re-emerging in 2026. This could take consensus views, focused more squarely on potential job losses as AI-initiatives are implemented, off guard this year. Materials and energy are two of the top performing sectors in…

Read More

Line chart titled S&P 500 Inflation Proxies are Surging this Year showing Energy and Materials index levels rising from 2020 to 2026, with Energy peaking at 813.5 and Materials at 646.4.
February 5, 2026

Tech’s Time Close to the Sun May Be Ending, and It Means a New Market Landscape

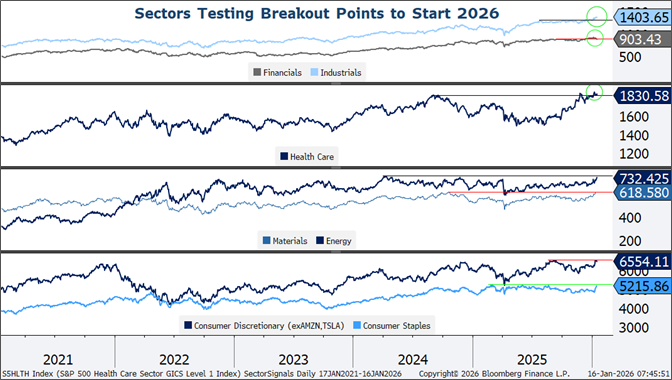
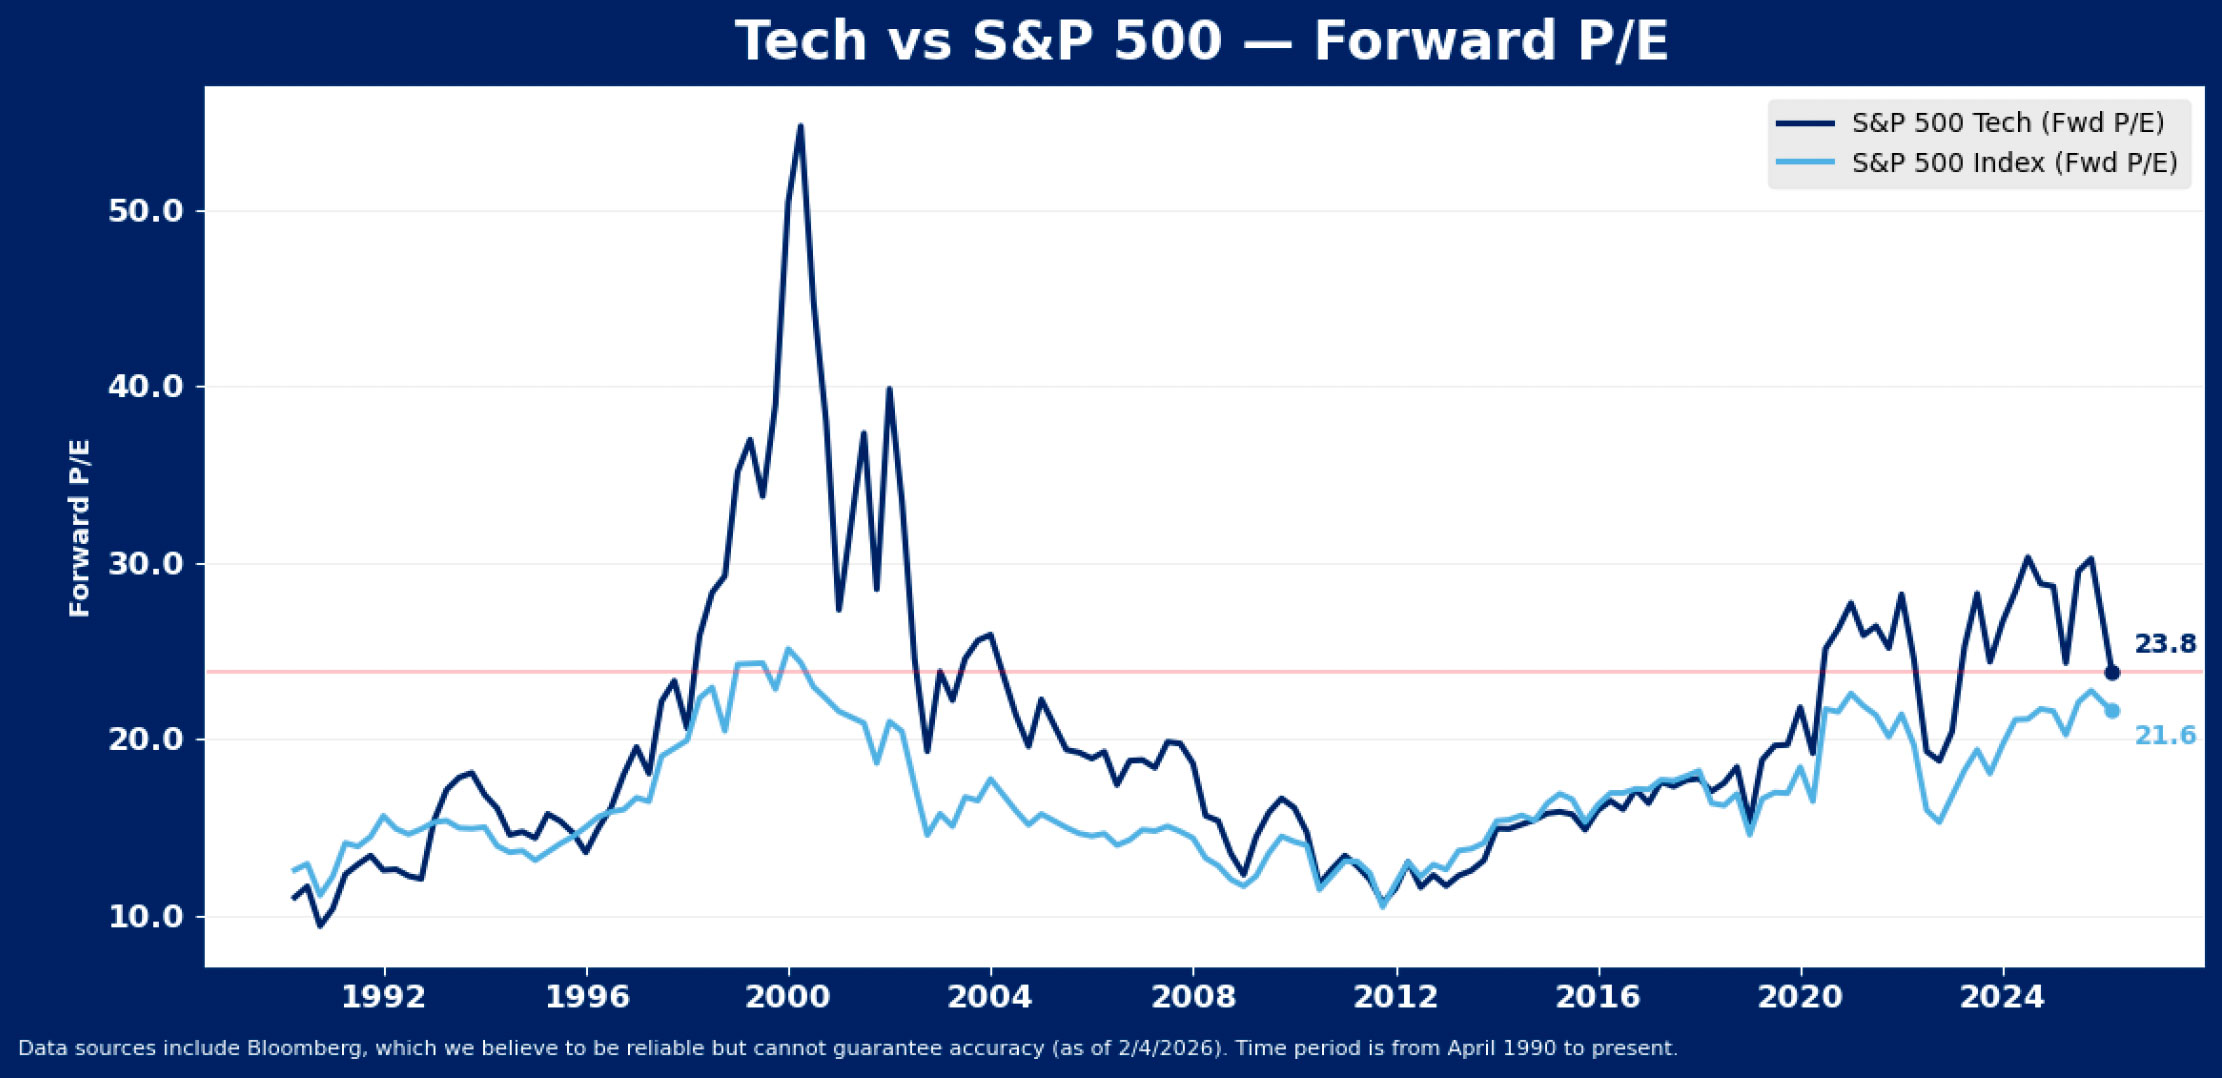
U.S. equity markets’ rotation out of technology has come a long way over the last few months, and the sector is now trading at just a 10% premium to the rest of the market. The sector’s earnings may justify a modest premium to the index, but only if growth can…

Read More

Line chart comparing forward P/E ratios of S&P 500 Tech (dark blue) and S&P 500 Index (light blue) from 1990 to 2024. Tech peaks around 2000; as of 2024, Tech is at 23.8, Index is at 21.6.
February 2, 2026

Stocks are Expensive – What Does That Mean for Returns?

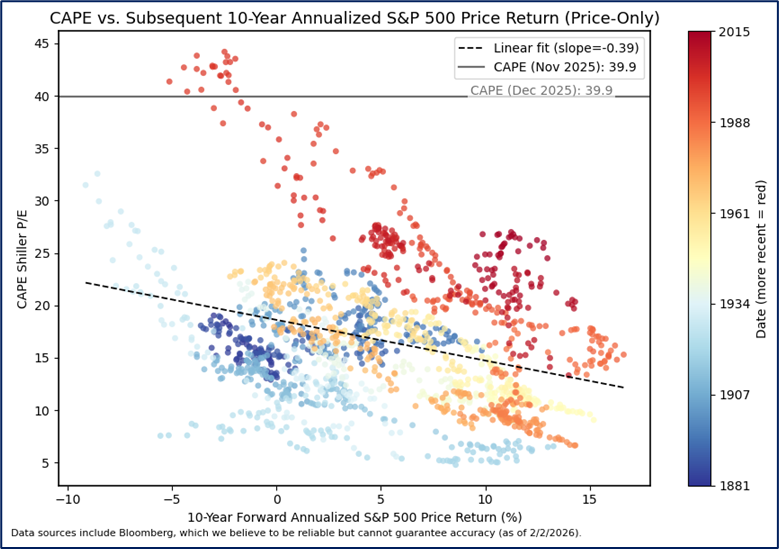
U.S. large cap stocks ended 2025 in rare valuations territory, with the cyclically adjusted PE ratio (CAPE) of 39.9 in the 99th percentile of all observations since 1881. US stock valuations by this measure are near 150-year highs, well north of the long-term average of 17.7, and even substantially higher…

Read More

Scatter plot showing the relationship between CAPE Shiller P/E and 10-year annualized S&P 500 price return, colored by date from blue (earlier) to red (more recent). A downward-sloping linear fit line is shown.
January 29, 2026

Gold and Silver are Glittering Like its 1979

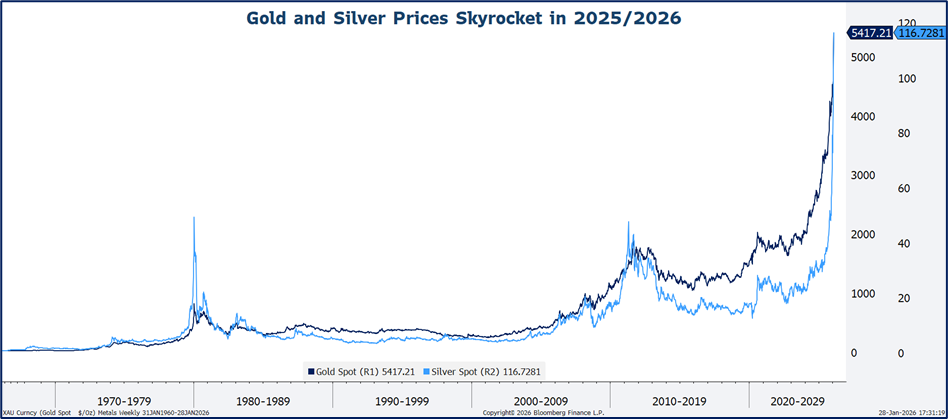
Metals prices are breaking records so far in 2026, hitting new all-time price highs and recording rates of price change last touched in 1979. Back then, prices rose until higher interest rates and a painful recession emerged. This time, gold might continue to run until geopolitical stability or an effort…

Read More

Line graph showing gold and silver spot prices from 1970 to 2029, with both prices rapidly increasing and peaking in 2025/2026. Gold is at $5412.21 and silver is at $116.78 at the top right of the chart.
January 28, 2026

Even Without an Ease, The Fed is Still Easy

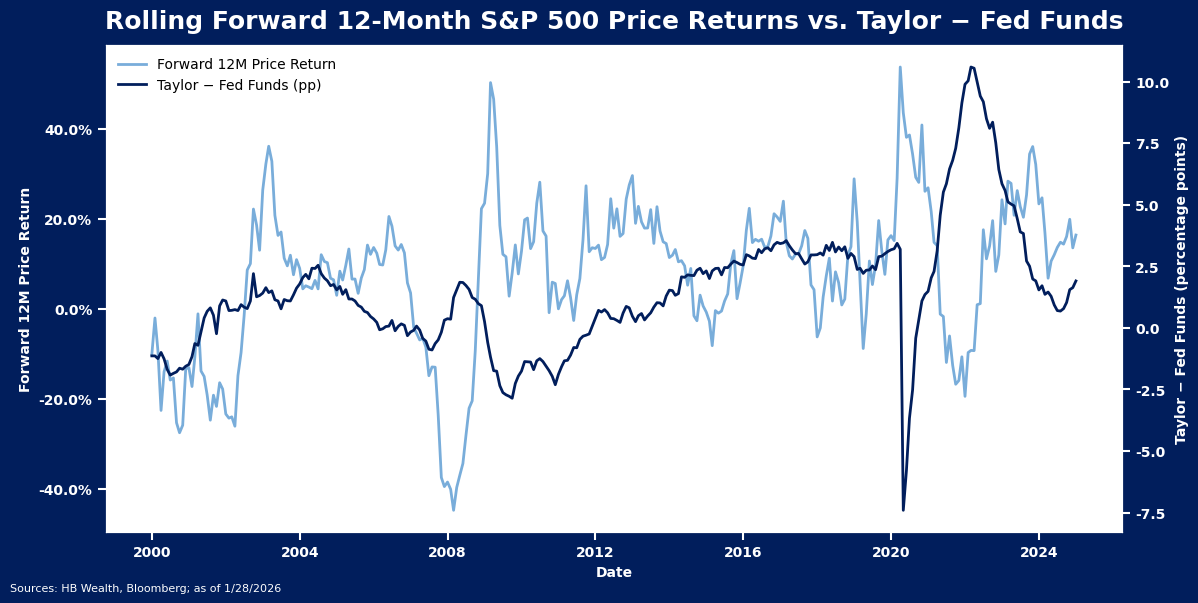
The FOMC paused rate cuts in January, with stabilizing labor markets and inflation pressures offering little reason to ease more at the current time. They didn’t need to ease more to stay easy anyway – after three consecutive declines in the benchmark rate in late 2025 the Taylor rule suggests…

Read More

Line chart showing rolling forward 12-month S&P 500 price returns (dark blue) and Taylor–Fed Funds rate difference (light blue) from 2000 to 2024, with both series fluctuating but rarely moving in sync.
January 21, 2026

Geopolitical Turmoil May Continue to Elevate Value of International Diversification

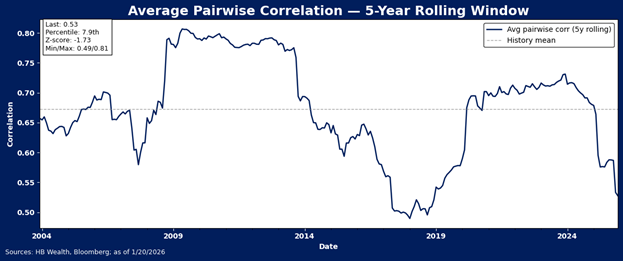
International equities meaningfully outperformed US stocks last year, but the value of holding non-domestic stocks extends well beyond returns. Critically, correlations among markets have been falling and dispersion of returns between regions has been rising as well, elevating the diversification benefit of international stocks. As geopolitical and trade risks continue…

Read More

Line chart showing average pairwise correlation (5-year rolling) from 2004 to 2026, with values fluctuating between 0.49 and 0.87. The correlation peaks around 2009 and drops significantly after 2022.
January 16, 2026

So Far in 2026, Everyone but Tech is a Winner. Policy Currents Say It Won’t Last.

Domestic growth themes based on policy support and regulatory reprieve have largely driven equity market rotation out of tech and toward other sectors in the US equity market in recent months.  Renewed geopolitical turmoil and some disappointment on the domestic policy front now threatens to upend the party in 2026. …

Read More

Four line charts show sector performance from 2023 to early 2026: Financials/Industrials, Health Care, Materials/Energy, and Consumer Discretionary/Staples, with each sector testing breakout points at the start of 2026.
  • « Previous
  • 1
  • 2
  • 3
  • 4
  • 5
  • Next »

Want To Learn More About HB Wealth?

Request a Consultation
HB_WEALTH_White.svg
Georgia

Atlanta (HQ)
Alpharetta
Augusta
Sandy Springs

Florida

Palm Beach
Tampa

Maryland

Columbia
Towson

North Carolina

Charlotte

South Carolina

Columbia
Greenville

Tennessee

Nashville

Facebook Twitter LinkedIn Instagram Youtube
  • © 2026 Copyright - HB Wealth
  • Privacy Policy & Disclosure
  • Form ADV
  • CRS
  • Contact Us