LOGO BLUE
LOGO BLUE
  • About Us
    • The HB Wealth Story
    • Our Purpose
    • The HB Wealth Difference
      • Fee-Only Fiduciary Commitment
      • Credentialed Experts
      • Comprehensive Advice
      • Concierge-Level Care
      • Private Market Expertise
    • Community
    • Cultural Commitment
    • Awards and Recognition
  • Our Services
    • Wealth Advisory Services
      • Financial Planning
      • Executive Financial Planning
      • Multi-Generational Planning
      • Estate Planning Services
      • Tax Planning Services
      • Interactive Planning
      • Wealth Forecast
      • Retirement Planning Services
      • Insurance Planning
      • Administrative Services
      • Charitable Planning
      • Education Planning
    • Investment Management
      • Private Market Investments 
      • Key Investment Principles
      • Online Reporting
      • Our Investment Process
      • Our Investment Expertise
      • Investment Communication
      • Investment Risk Management
    • Family Office Services
    • Service Levels and Costs
  • Who We Serve
        • Individuals and Families
          Business Owners and Entrepreneurs
          Corporate Executives
          Professional Service Practitioners
          Female Wealth Creators
          Suddenly Single Individuals
          Multi-Generational Families
          Institutions
          Individuals and Families
          Individuals and Families

          We are privileged to serve families across 48 states with their wealth management needs including comprehensive advice, financial planning, and investment management, all with a mission of providing unwavering financial peace of mind.*

          *As of December 31, 2025

          See How We Help Individuals and Families
          A smiling family of four poses outdoors on a sunny day. The father has a child on his shoulders, while the mother and another child stand close, all looking happy with trees and blue sky in the background.
          Business Owners and Entrepreneurs
          Business Owners and Entrepreneurs

          We work with successful business owners to help them navigate pre-sale planning, post-sale investing, asset protection, charitable giving, and long-term wealth forecasting to align financial strategies with lifestyle goals.

          See How We Help Business Owners and Entrepreneurs
          A middle-aged man with gray hair and a beard, wearing a light plaid shirt and beige pants, stands smiling with arms crossed in front of a glass door and bookshelves in a cozy, well-lit shop or library.
          Corporate Executives
          Corporate Executives

          We develop custom strategies for executives with concentrated stock and options complexities, including tax planning, cash-flow modeling, executive benefit optimization, retirement planning, and advisor coordination to free up time while aligning corporate and personal goals.

          See How We Help Corporate Executives
          Confident older woman with gray hair wearing a light-colored blazer and blouse, standing with arms crossed and smiling in a modern office environment with glass walls.
          Professional Service Practitioners
          Professional Service Practitioners

          We assist attorneys, physicians, consultants, CPAs, and other professionals with ongoing wealth planning, creating customized portfolios, and coordinating with trusted advisors to navigate and manage complex wealth and professional transitions.

          See How We Help Professional Service Practitioners
          A smiling man in a blue blazer and beige pants sits on a desk with his arms crossed in a modern office, with shelves of binders and a laptop visible in the background.
          Female Wealth Creators
          Female Wealth Creators

          We support women building and managing wealth with personalized planning, tailored investment strategies, coordinated tax and retirement guidance, and long-term legacy planning designed to reflect their goals and values.

          See How We Help Female Wealth Creators
          A woman with long blonde hair, wearing a sleeveless black dress, sits on a light grey armchair in a bright room with large windows and white curtains, smiling softly at the camera.
          Suddenly Single Individuals
          Suddenly Single Individuals

          We support individuals navigating divorce or loss by organizing finances, setting goals, building advisor teams, reviewing legal documents, and fostering connections to offer clarity and community amidst major life transitions.

          See How We Help Suddenly Single Individuals
          A woman with short dark hair, wearing a white button-up shirt and a black necklace, sits on a gray couch against a plain light-colored wall, smiling gently at the camera.
          Multi-Generational Families
          Multi-Generational Families

          Our multi-generational family office services extend beyond planning and investing to include consolidated reporting, entity structuring, administrative support, family education, insurance reviews, and independent due diligence tailored to each family’s unique needs.

          See How We Help Multi-Generational Families
          Three generations of a smiling family—grandparents, parents, and two children—stand together with arms around each other in a sunny park, with a fluffy white dog sitting in front on the grass.
          Institutions
          Institutions

          We provide tailored investment management services to select corporations, endowments, foundations, and nonprofits through an Outsourced Chief Investment Officer (OCIO) model designed to alleviate ongoing investment management tasks so your team can focus on fulfilling your organization’s mission.

          See How We Help Institutions
          A confident older woman in business attire stands smiling with arms crossed in front of a diverse group of four professionally dressed colleagues, all smiling and standing in a bright office setting.
        • Individuals and Families
        • Business Owners and Entrepreneurs
        • Corporate Executives
        • Professional Service Practitioners
        • Female Wealth Creators
        • Suddenly Single Individuals
        • Multi-Generational Families
        • Institutions
  • Meet The Team
    • Wealth Advisors
    • Client Service
    • Investments
    • Leadership
    • Business Operations
  • Our Offices
    • Atlanta, GA
    • Alpharetta, GA
    • Augusta, GA
    • Sandy Springs, GA
    • Palm Beach, FL
    • Tampa, FL
    • Towson, MD
    • Columbia, MD
    • Charlotte, NC
    • Columbia, SC
    • Greenville, SC
    • Nashville, TN
  • Insights and News
    • Blog & Market Commentary
    • Helpful Resources
      • How to Select an Advisor
      • Understanding Family Offices
    • HB Wealth in the News
    • Market Sense
  • Careers
  • Request a Consultation
  • Client Login
LOGO BLUE

Market Sense

Market Sense

  • Home
  • Insights and News
  • Market Sense

By:

A woman with long brown hair wearing a blue blazer and a necklace smiles at the camera. The background is softly blurred with light and blue tones.
Gina Martin Adams, CFA, CMT
Chief Market Strategist, Shareholder
A young man with short brown hair, wearing a dark suit, white shirt, and blue tie, stands in front of a blurred background with lights and blue tones.
Matthew Sanders
Senior Investment Research Analyst
A smiling man in a blue suit, white shirt, and blue tie stands in front of a blurred, modern indoor background with circular lights.
Michael Casper, CFA
Director, Senior Market Strategist
January 13, 2026

Mind These Gaps During 4Q Earnings Season

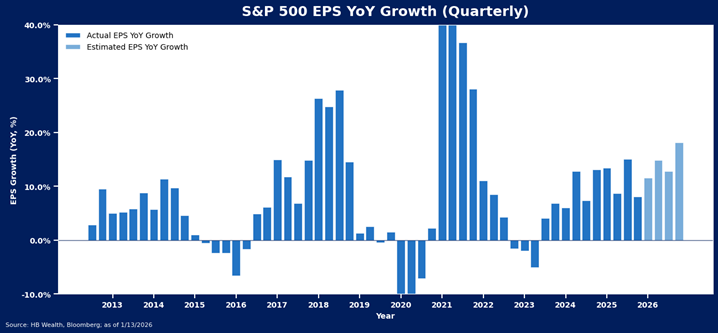
Analyst expectations for about 8% growth in S&P 500 EPS in the fourth quarter earnings season appear likely to be easily beaten, but the forecast for the index to accelerate the pace and end 2026 with nearly 20% EPS growth remains up for debate.  Likewise, our macro model suggests the…

Read More

Bar chart showing S&P 500 quarterly EPS year-over-year growth from 2013 to 2026, with actual growth through 2023 and estimated growth from 2024-2026. Growth varies, peaking around 2021 and dipping in 2020.
January 9, 2026

Stocks Bull Charge May Slow its Pace in 2026

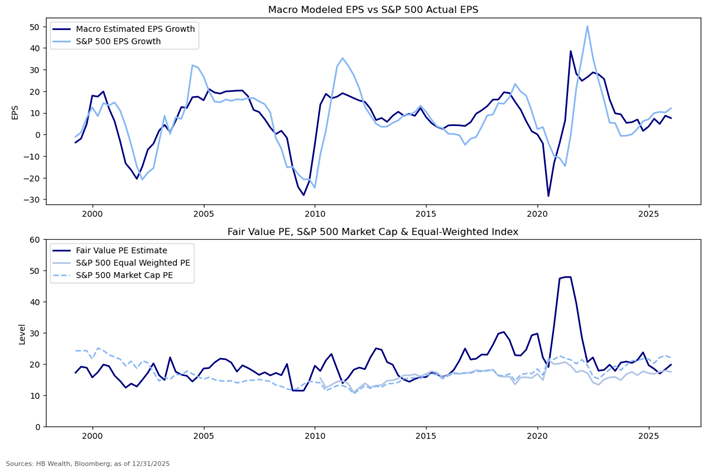
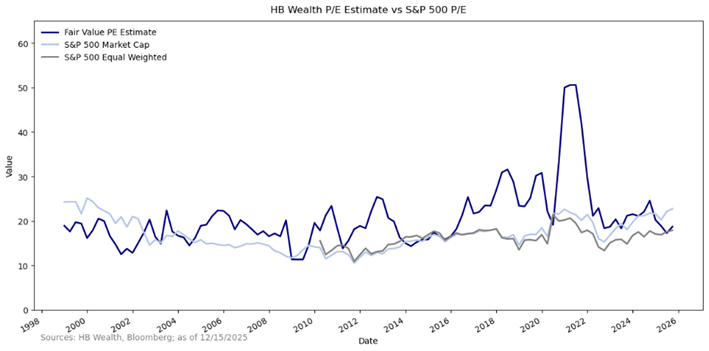
Our macro model for S&P 500 valuations shows multiples have jumped too far ahead of macroeconomic support and this may slow the pace of index price growth in the near term. This model suggested markets were largely undervaluing low interest rates for most of the last two decades, supporting the…

Read More

Bar chart showing forward 12-month returns based on fair value signal. When Fair Value PE > S&P 500 PE, mean return is 9.3%, median is 12.5%. When Fair Value PE ≤ S&P 500 PE, mean is 3.1%, median is 5.0%.
January 5, 2026

Bull Market May Need Both an Easy Fed and Robust Earnings in 2026

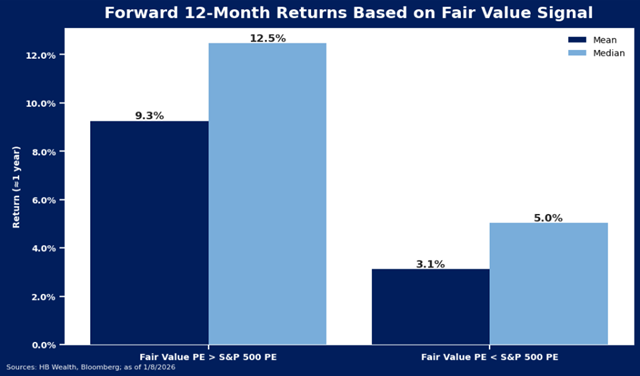
January events could set the tone for stocks in the year ahead, as elevated market multiples imply both the Q4 earnings season and FOMC Meeting are likely to be critical moments that set the stage for equity market direction. Given valuations for the market are well north of levels justified…

Read More

Two line charts: Top shows Macro Estimated EPS Growth vs. S&P 500 EPS (2000-2025); bottom shows Fair Value PE, S&P 500 Equal Weighted PE, and Market Cap PE (2000-2025). Data fluctuates, with notable spikes around 2020.
December 22, 2025

Can the Bull Keep Charging in 2026?

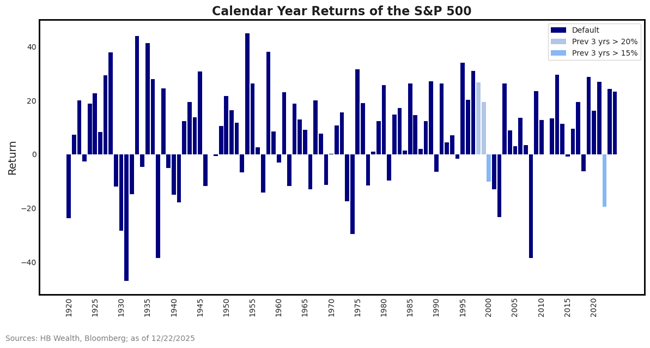
The S&P 500 is on pace for a third consecutive year of more than 15% price growth, and if a Santa Claus rally takes shape in the final trading days of the year, it could hit rare air with a third straight year of 20% growth.  There is little historical…

Read More

Bar chart showing annual returns of the S&P 500 from 1925 to 2025. Bars are colored by previous 3-year returns: blue for default, medium blue if >15%, and dark blue if >20%. Returns vary widely, with notable dips and spikes.
December 19, 2025

Can Lower CPI Boost Stocks?

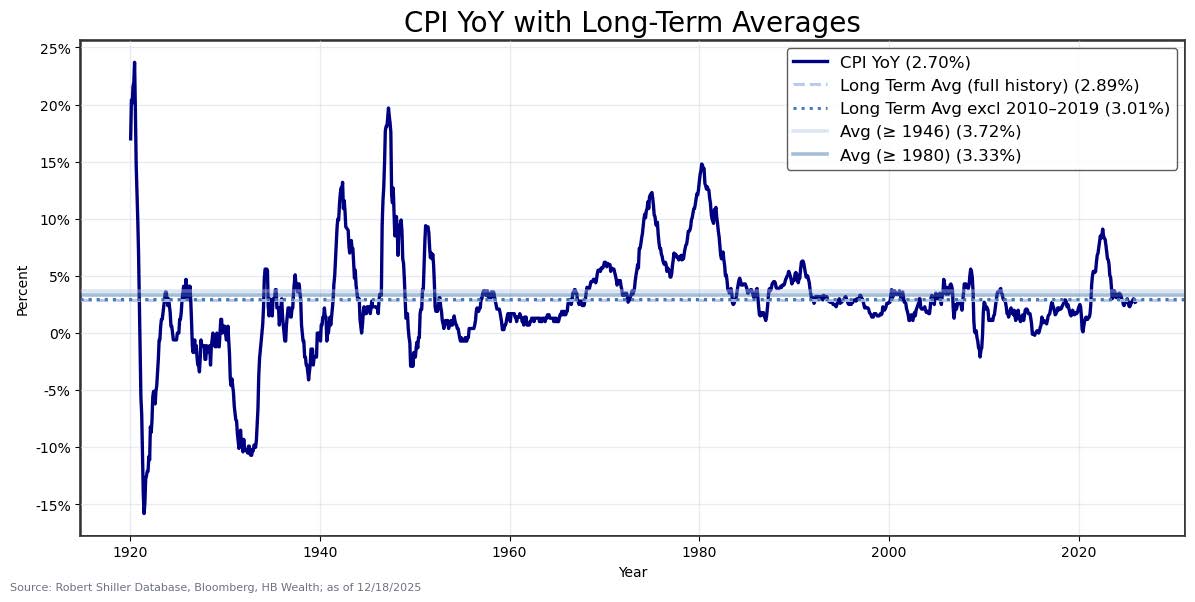
After rising for the bulk of the summer, consumer prices finally eased somewhat this fall, and the consumer price index (CPI) hit its slowest pace of growth since 2021 in November. It is too early to call an “all clear” on inflation risks, as autumn data may be somewhat distorted…

Read More

Line chart of U.S. CPI year-over-year inflation from 1920 to 2024, with long-term average lines for full history, post-1946, and post-1980 periods; shows high inflation mid-century and averages near 3%.
December 17, 2025

Equity Valuation Model Suggests it’s Time for New Leadership to Emerge

Stocks rallied on welcome news of another round of liquidity provision and brightening growth from the Federal Reserve last week, only to unwind the trade (and then some) in recent days. Our valuations Model suggests the equity market may continue to struggle to see a few more Fed cuts as…

Read More

Line graph comparing HB Wealth P/E Estimate, S&P 500 Market Cap, and S&P 500 Equal Weighted from 2006 to 2026; HB Wealth P/E spikes sharply around 2020 before aligning closer to the S&P 500 lines.
December 12, 2025

Fed’s Growth Signal Offers Optimistic Tone for Stocks

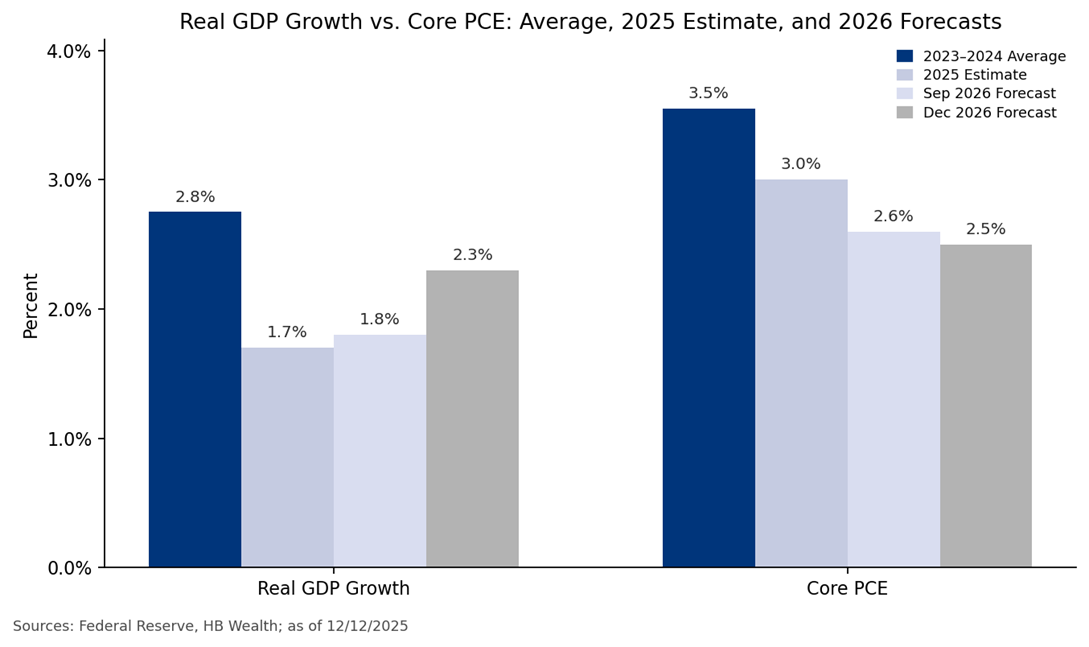
The Federal Reserve meeting this week offered more than just a liquidity cue for markets.  It also contained hints that the time for AI to morph from tech profits-driver to broader economic force may be emerging.  If growth accelerates while inflation eases, as the Fed now expects, S&P 500 profits…

Read More

Bar chart comparing Real GDP Growth and Core PCE projections for 2023-2024, 2025, and 2026. Real GDP Growth ranges from 1.7% to 2.8%; Core PCE ranges from 2.5% to 3.5%. Data from Federal Reserve and HB Wealth.
December 10, 2025

It’s Momentum’s World. The Rest of Stocks are Just Living in it

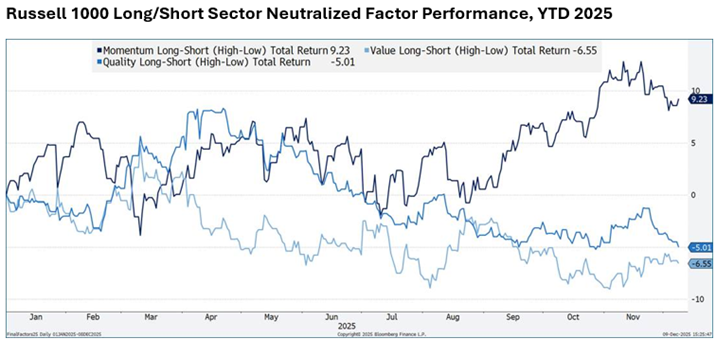
Momentum is the only major factor that is working in the U.S. large cap equity market in 2025, as well as in the bull market that began in 2023.  The total return spread between high momentum and low momentum stocks is up 9% so far this year, far outpacing all…

Read More

Line graph showing 2025 performance of Russell 1000 long/short factors: Momentum (dark blue) rises sharply, ending at 9.23; Value (medium blue) declines to -6.55; Quality (light blue) drops to -5.01. Dates run Jan-Dec 2025.
December 4, 2025

S&P 500 Valuation Gap May be Set to Close in 2026

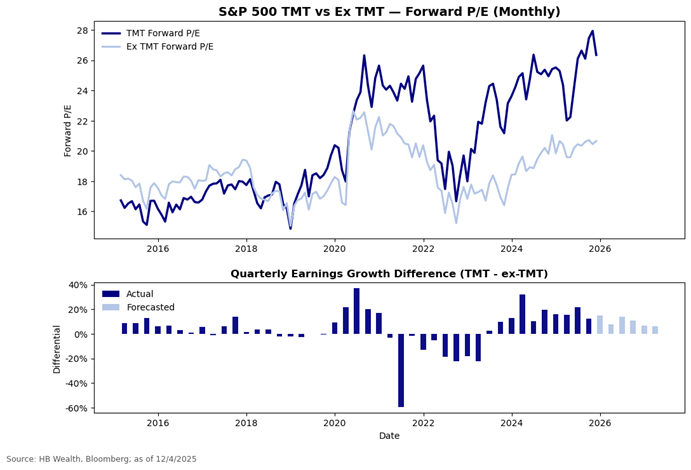
AI stocks’ earnings dominance has resulted in bloated multiples for S&P 500 tech, media and telecom (TMT) stocks, as investment dollars concentrated in the strongest growth opportunities in the index.  However, the analyst consensus sees a more normalized environment for earnings emerging with policy support in 2026. This closing of…

Read More

Line chart compares the forward P/E ratio of S&P 500 TMT vs ex-TMT monthly, showing TMT rising above ex-TMT from 2023 to 2026. Bar chart below shows quarterly earnings growth differences between the two groups.
  • « Previous
  • 1
  • 2
  • 3
  • 4
  • 5
  • Next »

Want To Learn More About HB Wealth?

Request a Consultation
HB_WEALTH_White.svg
Georgia

Atlanta (HQ)
Alpharetta
Augusta
Sandy Springs

Florida

Palm Beach
Tampa

Maryland

Columbia
Towson

North Carolina

Charlotte

South Carolina

Columbia
Greenville

Tennessee

Nashville

Facebook Twitter LinkedIn Instagram Youtube
  • © 2026 Copyright - HB Wealth
  • Privacy Policy & Disclosure
  • Form ADV
  • CRS
  • Contact Us