








Abstract:
- AI stocks drove 40% of year-to-date gains for the S&P 500 but have been in a bear market since their June peak. Of the two sub-baskets that comprise the broader AI-trade – AI spenders and AI suppliers – the AI suppliers group has been particularly volatile of late. Over the past month, every part of the AI trade has fallen 17–21% (suppliers −18%, spenders −19%, AI software −21%) as the S&P 500 slipped 3%. Over the same period, the anti-AI basket gained 10%.
- Stocks with low correlations to excess AI-supplier returns could help mitigate some of the volatility. Such “Anti-AI” stocks include hefty doses of financials, health care and industrials. A basket of these anti-AI stocks rallied 13% while the AI group dropped from its October high to the November low.
- Sectors most correlated to AI suppliers, like information technology and industrials, may remain vulnerable to market nerves around the path for AI spending. These have suffered the most this summer and fall while the least related groups have outperformed.
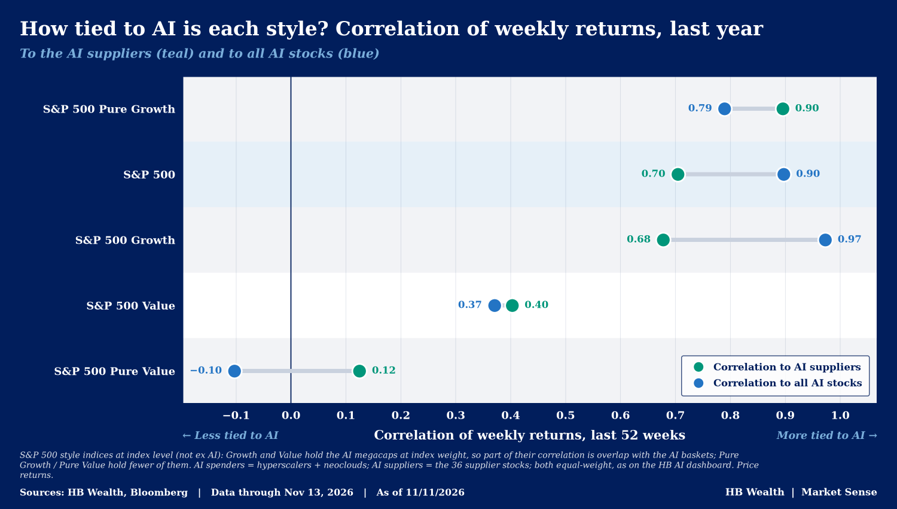
- The AI trade drove the large divergence in style performance in 2H26. Growth stocks remain especially correlated to AI suppliers while value is relatively unrelated to the trade.
AI stocks – including semis, hyperscalers, parts of software, infrastructure and others providing critical support to the AI build — have driven 40% of the S&P 500 return so far this year. However, the basket is not ubiquitous. AI-suppliers – companies that sell the hardware, infrastructure and power behind the AI build out, from chipmakers like NVIDIA to networking, server, electrical equipment, and power generation — sharply outperformed in the first half of the year while AI-spenders, largely comprised of hyperscalers and neoclouds, posted more muted returns. AI-software –an equal-weighted group of companies that sell AI-powered applications and data platforms to businesses– comprises the third leg of the trade and have been less affected by recent volatility.
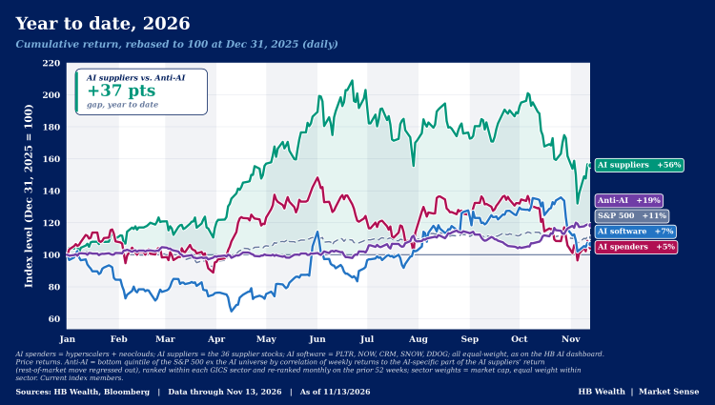
This year has been a tale of two halves for the broad AI-trade. At large, AI stocks were up 76% at their year-to-date peak in June, led by AI suppliers (up 109%), AI spenders (up 48%) and AI-software (up 14%). Since then, the suppliers (down 25%) have taken it on the chin, hitting their lowest point since May following the following the midterm election that has raised fears of an impending slowdown in domestic data center construction. Likewise, AI spenders have slid more than 29% from their mid-year peak and briefly dipped into negative territory for the year with the November selloff. Both have recovered somewhat in the week following the election, but a basket of anti-AI names has held steady throughout the turmoil, gaining 18% since the broader AI basket hit its apex in June.
Who are the Pure Anti-AI Stocks? Financials, Health Care and Industrials
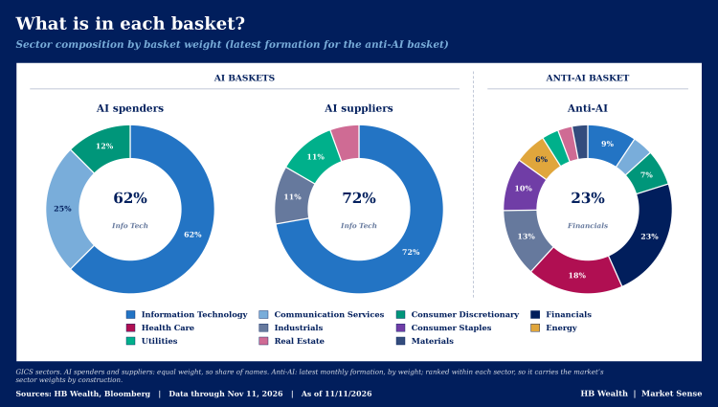
Recent volatility is conversely driving renewed interest in “Anti-AI” companies – the stocks in the S&P 500 that aren’t part of the AI trade and are least correlated to the AI suppliers that have been whipsawed the most this year. A basket of these anti-AI stocks (neutralized by sector and AI-beta) is up 19% this year. Since the most recent peak in AI suppliers and spenders in October, the pure anti-AI basket is up 18%, reflecting its use as a portfolio diversifier. The group maintains heavy concentrations of financials, health care and industrials with sizable staples, tech and utilities exposure. It has negative 0.34 and 0.22 correlations to the AI suppliers and overall AI basket, respectively.
AI Explains Growth-Style Pain Since Early Summer
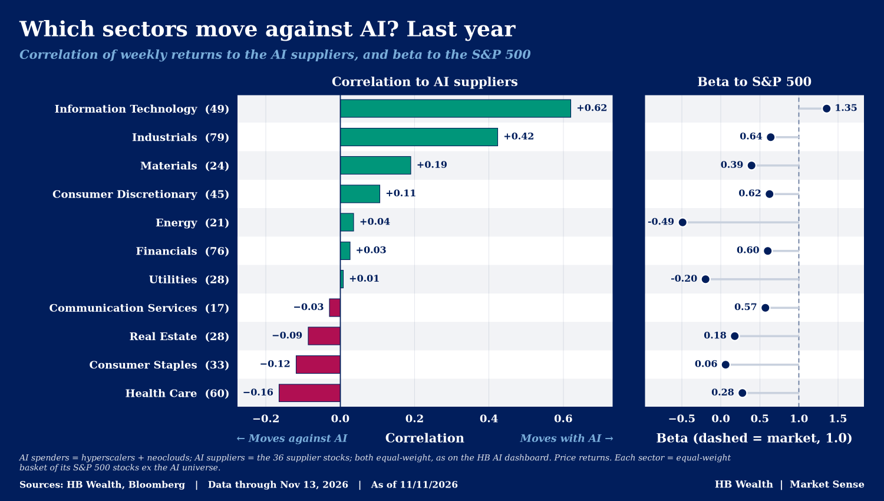
If AI-supplier stocks continue to weigh on the market, it is likely to be felt the most by growth and tech, industrials and materials stocks given past year correlations. Without AI stocks included, health care, staples, communications, real estate, financials and energy are the least correlated to the AI suppliers basket. Thus, it should be no surprise that since the peak in the AI suppliers back in June, health care, energy, staples and financials stocks have led. Conversely, tech – even without its AI stocks – is heavily correlated to suppliers at large, followed by industrials, materials and discretionary.
Likewise, S&P 500 growth stock correlations to AI are much higher than value-style peers – explaining much of the volatility in style performance in 2H. Over the past year (on a weekly frequency), the S&P 500 pure growth index has been 0.9 and 0.79 correlated to the AI suppliers and overall AI baskets, respectively, while the standard definition of growth is 0.7 and 0.90 correlated. While the index at large is similarly linked to AI, the pure value index is just 0.12 corelated to AI suppliers and negative 0.10 correlated to all AI stocks. That explains why, since the June high in AI stocks, pure growth is down 18.5% versus an 8.9% rise for value.
Disclosure: HB Wealth is an SEC‑registered investment adviser. The information reflects the author’s views, opinions, and analyses as the publication date. The information is provided for informational purposes only and does not constitute an offer to sell or a solicitation of an offer to buy any investment product. This information contains forward-looking statements, predictions, and forecasts (“forward-looking statements”) concerning the belief and opinions in respect to the future. Forward-looking statements involve risks and uncertainties, and undue reliance should not be placed on them. There can be no assurance that forward-looking statements will prove to be accurate, and actual results and future events could differ materially from those anticipated in such statements. The information does not represent legal, tax, accounting, or investment advice; recipients should consult their respective advisors regarding such matters. Certain information herein is based on third-party sources believed to be reliable, but which have not been independently verified. Past performance is not a guarantee or indicator of future results; inherent in any investment is the risk of loss.