








Abstract:
- Emerging market (EM) stocks are surging in 2026 and have more than doubled the gain for developed markets.
- However, that outperformance is driven by a handful of companies. The median company in emerging markets is down for the year and tech is the only EM sector up over the last three months.
- The group now carries significant sector and country concentration risk – tech’s weight in the emerging market index is now larger than its share in the S&P 500. Korea and Taiwan combined make up nearly 40% of the gauge.
- Still, valuations make a compelling case for strategic investors willing to ride out near term volatility. EM equities PE is low compared to developed markets, and a majority of sectors are still discounted to their peers.
AI is Powering Up Emerging Market Index Returns But Leaving Most Stocks Behind
Emerging market (EM) equities had a stellar first half of 2026, and with their gain of more than 24% in the first half, have more than doubled the return of developed markets, including the U.S. However, the rally has been increasingly concentrated. This leaves emerging markets vulnerable to negative surprises in a single industry – semiconductors, and two countries – Taiwan and Korea.
Most of the distortion happened in the second quarter. Over the last three months, technology is the only sector that posted a positive return in emerging market equities (up 14.8%). All other sectors in EM were flat (financials) or down (the rest). As chip stocks surged, the rest of the market has been left behind to struggle with war in the Middle East. The shock of higher oil prices and broader commodity supply constraints is expected to have a disproportionately negative impact on emerging market economies, and this has resulted in poor performance across many of the benchmark’s equities.
Reflecting this two-theme conundrum for EM equities, market breadth, as measured by the percentage of stocks in the Emerging Markets Index trading above their 200-day moving average, has been falling as the market rallied this year. Currently less than half of the index constituents are trading above the key 200-day moving average level. Just 44% of stocks in the emerging market index are positive year-to-date while only 29.1% of stocks have posted more than a 10% gain for the year.
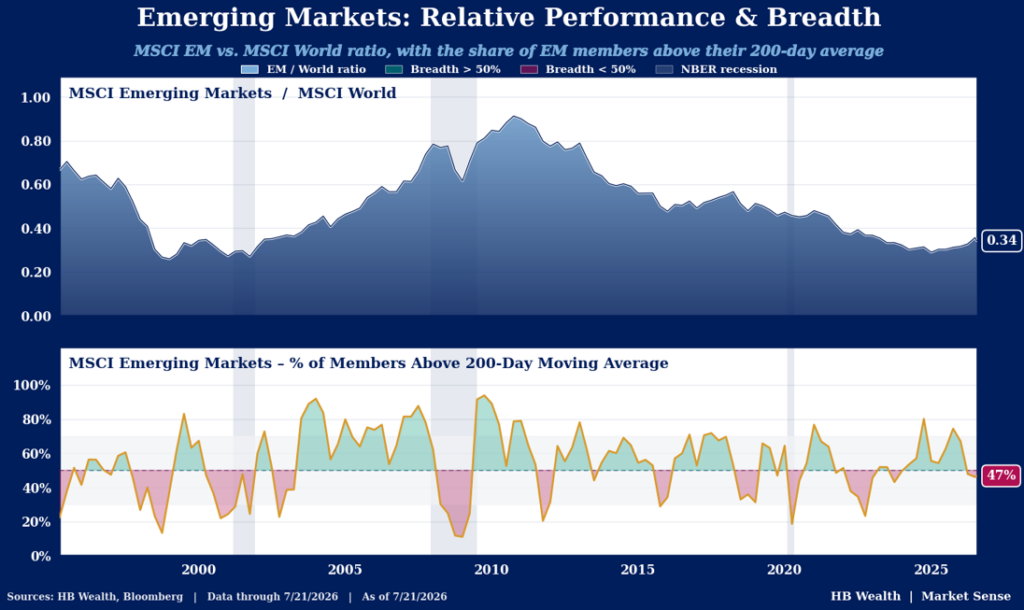
Weak breadth is unusual during an enduring uptrend, and highlights a near term risk to emerging market returns. During the last multi-year period of outperformance for Emerging Markets (in 2002-2007), breadth confirmed the market gain, and more than 50% of the index constituents persistently participated in the rally. Emerging markets’ outperformance last year was largely supported by breadth as well, but this changed with the crossing currents of war and AI investment.
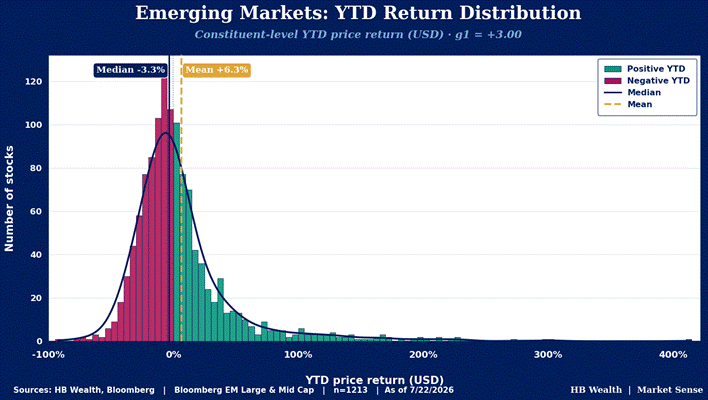
Distribution of returns shows the lack of participation especially clearly — just 23.9% of stocks in the index have exceeded the 15.1% YTD gain in the overall emerging markets index. Likewise, the mean and median show a significant skew in results thus far in 2026 with the average emerging market stock up 6.3% but the median down 3.3%, reflecting the handful of outliers driving the outsized return.
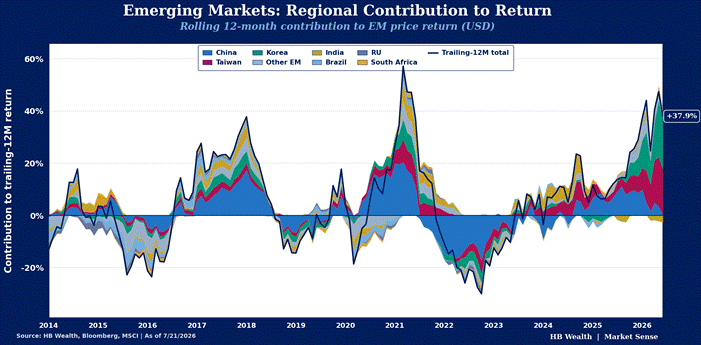
This two-speed market has left the emerging market index extremely concentrated. China is still the largest country by market cap, at 590 stocks and a weight of 27% of emerging markets, but Taiwan, a country with only 71 stocks in Bloomberg’s index, is now nearly as large, at 23%. South Korea, with 86 members, is another 16% of the index, topping India’s share (180 members). After driving nearly all of the EM index gain over the last twelve months, Taiwan and Korea are together almost 40% of the gauge’s market cap. This is a record high share for the two countries.
Valuations Highlight the Longer-Term Case for EM
This concentration leaves emerging market equities somewhat vulnerable to any downside surprise that may emerge in the semiconductor industry. However, it also highlights the room left for recovery should conditions in the Middle East stabilize. Also, while EM stocks may remain troubled by Middle East war in the near term, valuations still present significant opportunity for investors with longer term perspective.
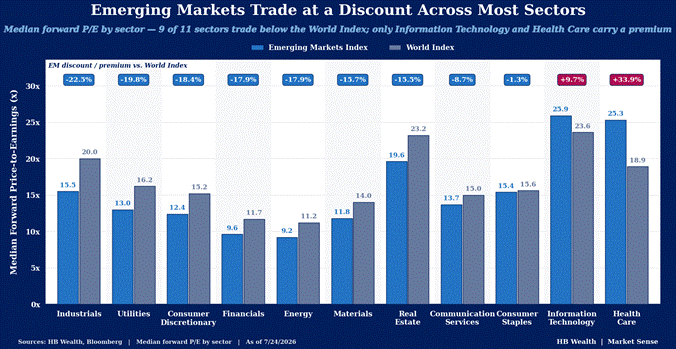
Overall, the emerging markets carry a median 13.9x forward P/E ratio, well less than the 16.8x commanded by their developed counterparts (including the US). Some of this is the distortion from semiconductors. However, excluding the tech sector, emerging markets trade at 16.2x forward earnings. This compares to 20.4x for U.S. large caps and 15.8x for developed markets outside the U.S.
Nine of the 11 sectors in EM still trade at discounts to their DM (including US) counterparts, with the widest discount in real estate, financials, and communications. Of the 31 countries in the Emerging Market index, 12 trade at a discount to their own 5-year average with Indonesia, Saudi Arabia, and Singapore being the cheapest relative to their history.
Disclosure: HB Wealth is an SECregistered investment adviser. The information reflects the author’s views, opinions, and analyses as the publication date. The information is provided for informational purposes only and does not constitute an offer to sell or a solicitation of an offer to buy any investment product. This information contains forward-looking statements, predictions, and forecasts (“forward-looking statements”) concerning the belief and opinions in respect to the future. Forward-looking statements involve risks and uncertainties, and undue reliance should not be placed on them. There can be no assurance that forward-looking statements will prove to be accurate, and actual results and future events could differ materially from those anticipated in such statements. The information does not represent legal, tax, accounting, or investment advice; recipients should consult their respective advisors regarding such matters. Certain information herein is based on third-party sources believed to be reliable, but which have not been independently verified. Past performance is not a guarantee or indicator of future results; inherent in any investment is the risk of loss.