








Abstract:
- Debt financing the AI buildout has become a defining theme in credit markets, with hyperscaler issuance nearing half a trillion dollars this year, making up roughly a third of all corporate supply.
- Credit spreads and credit default swaps for hyperscalers have widened as supply increased, sparking some fear of debt-driven risks emerging. However, this is so far largely a supply technical, not a sign of fundamentals weakening towards default.
- Comparisons to debt-driven bubble bursts of the past seem hyperbolic given hyperscaler’s fortress balance sheets – debt ratios are not comparable to debt ratios for the turn-of-the century telecom fiber build or the railroad boom of the late 1800s. Cloud revenue is also already starting to accelerate meaningfully and may help soothe cash flow concerns.
- Thus, repricing is likely a minor downgrade story rather than a major default story at the top of the capital structure. Segmentation in the credit market is key, for the distinction may be in the structure of each deal – senior hyperscaler debt is backed by durable core businesses, while project-level and securitized deals without explicit parent support carry more risk of principal loss.
- Supply driven spread widening on high-quality, well-managed credits can set up an opportunity to earn concessions historically reserved for lower rated paper. That payoff depends on balance sheet discipline and AI demand validating the increasing capex.
The AI Debt Deluge: Downgrade Risk, Not Default Risk – If You Own the Right Structure
While inflation, the Fed, and the deficit have largely dominated rate news over the past twelve to eighteen months, the credit side of the fixed income market has been defined by the growing volume of paper coming out of the AI buildout. Estimates for the five largest hyperscalers’ capex have climbed to nearly $785 billion for 2026 and more than $1 trillion for 2027, up from about $225 billion in 2024 and $380 billion last year. As cash flow growth fails to keep up with capex, these companies are increasingly turning to debt markets. So far, nearly half a trillion dollars in issuance has emerged from hyperscalers alone this year, representing one third of overall Investment Grade corporate debt issuance. There is growing evidence that this supply wave is starting to overwhelm demand, as the market has started to expect a premium for the debt. That repricing can present opportunity, but capturing it effectively depends on being able to parse two different risks that many headlines blur together. First is the structure of the underlying deal, as parent company guarantees can vary greatly, emphasizing the importance of understanding the legal documents for each bond. Second is whether this growth in leverage will pay off with enough new cash flow to keep credit metrics in line. At this stage, the hyperscalers’ relative balance sheet strength buoys their ratings while older GPU contracts reprice, which should be accretive absent additional acceleration in the trajectory of debt.
The New Issue Market Is No Longer Absorbing Supply Quietly
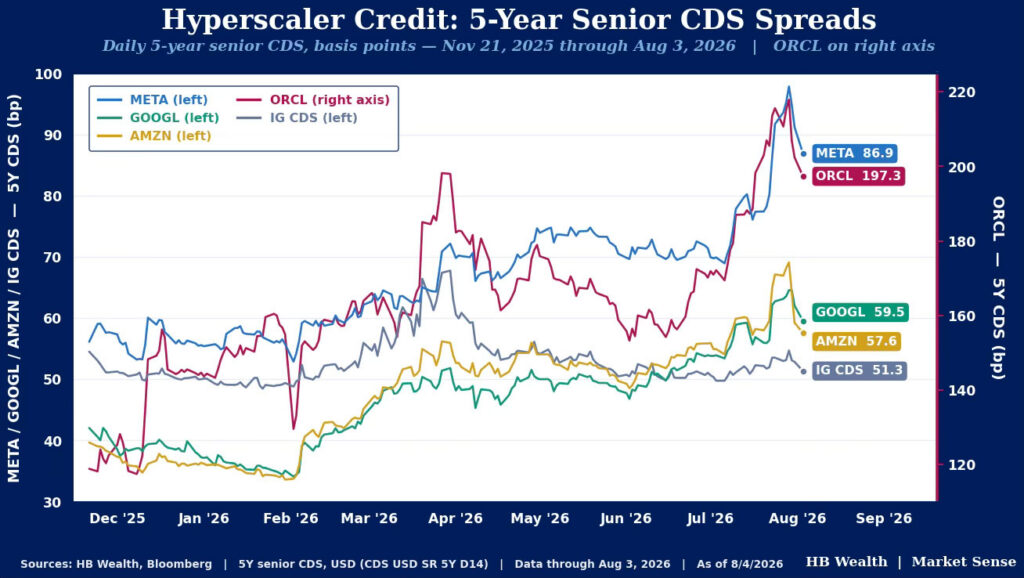
There is growing evidence of the market getting increasingly tapped out on AI debt. In aggregate, new deals are clearing the market at wider spreads as order books continue to thin from where they were six months ago. Five-year CDS for AMZN, GOOGL, META, and ORCL have all moved wider, so the secondary market is repricing risk at the same time.
Amazon’s surprise $25B deal in July moved its own 30yr bonds wider by 20bps as the sizeable supply outpaced even the ever-hungry passive curve buyers. Recently a $12.5B deal from BlackRock, named “Sopaipilla” was raised to finance a data center in Texas primarily for Meta. It priced at a 7.53% yield on the primary market, roughly 200bps over comparable A/AA-rated paper after being oversubscribed by only 1.6x vs an average of around 4x for other large AI deals earlier this year. When the deal was complete, the spread had grown to 288bps over treasuries and was the widest for an A-rated or better bond in three years.
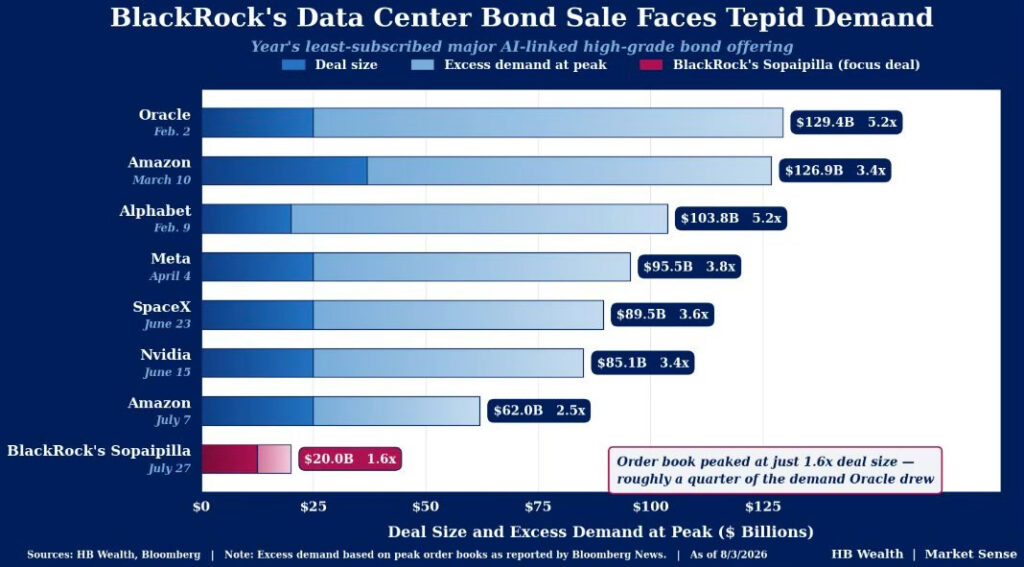
Alphabet is reportedly preparing another large deal with maturities out to 40 years. It issued 40-year bonds, and even a 100-year Sterling tranche, in February of this year when order books were still full. Seeing more 40-year bonds coming into a thinner market will be a telling test of appetite for long-dated AI credit. As of this writing, the terms are not final and could still shift.
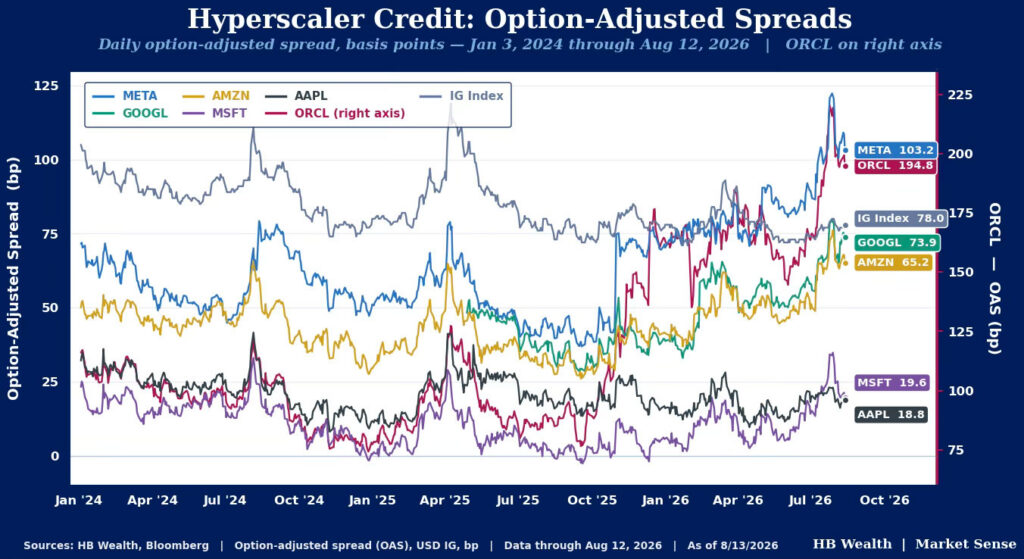
This deluge of issuance has led to meaningful widening of credit spreads, but it does not necessarily indicate an erosion of fundamentals. The highest quality issuers have retained their AA ratings, four of the five hyperscalers report net debt/equity that is barely positive (due to tremendous cash balances) and spread pressure has been primarily a supply technical rather than a credit event. Each large wave of issuance pushed spreads wider before those spreads stabilized and then tightened slightly. The Sopaipilla bond, for example, tightened around 20bps in the secondary market within a day of pricing as yield-focused buyers stepped in.
While the flood of issuance has saturated the longer end of the market, intermediate spreads of existing bonds show continued appetite overall for the cohort. Only META and ORCL have spreads wider than the broader IG index due to being the only names in the group with meaningful net debt to equity ratios.
Reading the CDS Signal
The CDS market is telling us we are in an environment of modest credit deterioration at the margin, which is certainly a real risk, but not necessarily a default risk for those at the top of the capital stack. There is debate among market participants regarding the credibility of widening CDS spreads as a signal of true credit risk. For a start, single-name CDS is a thinner, more manipulable market than the cash bonds themselves. Thus, signals should be interpreted accordingly. Also, default swaps of the large tech issuers have started moving increasingly in tandem with each other, as if the market is pricing deterioration in hyperscaler credit as one cohesive theme. This is somewhat suspicious given the idiosyncratic risks of issuers, and this parallel pricing among multiple issuers reinforces the case for active management.
A few things may be getting lost in the headlines focused on deteriorating free cash flow and new bond supply. For a start, spot pricing for GPU compute is roughly twice contracted rates, so as old contracts reprice, cloud revenue and operating cash flow should accelerate. If that persists and perhaps improves the balance between capex and cash flows, the funding gap that has developed because of oversupply fears should narrow.
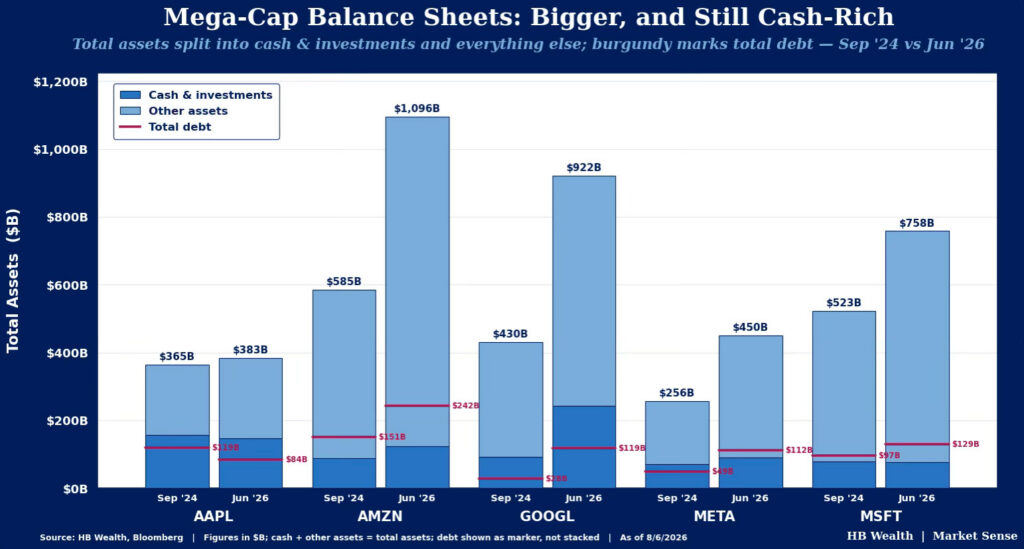
Credit support from parent companies’ balance sheets further improves the picture. The total assets of these companies have grown over the past 18 months such that the increase in debt does not make a drastic change in their financial ratios. That is, of course, a snapshot in time and does not account for the fact that the increase in debt has outpaced free cash flow, which could lead to deterioration over time.
Primary Concern is Rising Leverage
Rising leverage is naturally a primary source of downgrade risk – combined hyperscaler capex is now expected to take up 94% of operating cash flow in 2026 and 2027, vs less than half in 2023. On top of that visible bond supply, recent filings show an additional $800B+ of undiscounted lease commitments not yet on balance sheets, vs $675B in February. However, even accounting for the recent debt deluge, these companies remain minimally levered, suggesting fears of debt tipping the scales of the investment boom into bust are likely hyperbolic.
While rising debt loads have changed the landscape for these companies that were formerly heavily funded by cash flows, there are sizeable qualitative factors that help strongly mitigate risks of rising debt:
First is the strong starting point. Many of these names start this cycle at AA with low overall leverage, so there is room to add notable debt before ratings action becomes necessary. MSFT is still rated AAA and GOOGL, AMZN, and AAPL are all still AA+/AA, with four of the five running gross leverage below 1.0x and interest coverage in the mid to high double-digits. Even after debt issuance so far this year, net debt/EBITDA ratios for the hyperscalers are still a mere 0.2x on average. Even with the expected growth in overall debt, consensus estimates still hold net debt flat through 2028 due to Free Cash Flow growth from the established businesses of the parent companies. Even if the debt growth surpasses the ~$1T expectation, that would be met with a group that still collectively has nearly $3T in net cash after accounting for the current debt load.
Hyperscaler leverage is not currently comparable to past investment bubbles that ended badly. Railroads had average leverage, as measured by debt/equity, of roughly 3x, with buildout funded mostly through mortgage bonds and government land grants. Telecom/Fiber leverage was roughly 2x, with its buildout funded mostly through high yield bonds, bank loans, and equity issuance. Hyperscalers’ leverage ratios, in contrast, average roughly 0.5x, with buildout funded mostly through retained earnings, free cash flow, and modest (relatively speaking) debt issuance.
The cash flow component is starting to potentially turn a corner with accelerating cloud revenues, and as noted above, contract repricing might offer an additional lift. This makes the “94% of operating cash flow” figure looks less daunting in the coming quarters. So far in 2026, the pace of growth in cloud revenues for Google, AWS and Azure together has doubled to nearly 50% from its 2024-2025 pace. If analysts are correct, revenue from the AI build-out may start to surpass capex by 2029.
Another reassuring point is that management has demonstrated that it cares about the balance sheet. Several hyperscalers have supplemented debt with equity issuance for the sole reason of maintaining their credit profiles. The easier path would be to fund everything with debt, but management’s willingness to dilute equity to protect their balance sheet proves discipline and helps to keep a rating migration from becoming real distress.
Both the railroad and fiber builds were a matter of building too much too soon, which does give reason to dig into the current situation. However, those former investment booms involved companies with balance sheets unable to sustain a revenue lag. The current AI buildout is mainly coming from the most profitable companies in history with diversified cash flows that predate the AI buildout itself and still have cash flows independent of capex. That is why default risk at the parent level is low. Real impairment risk is likely in a smaller, single-asset, GPU-collateralized group.
The Opportunity: Two Groups, Two Very Different Risks
In the end, absent more legs higher in debt of recent magnitude, the supply-driven widening on well-managed credits sets up opportunities for excess return. Structure is improving with more direct, and sometimes indirect, parent company guarantees on new debt. This is far from free money, each of the mitigants laid out depends, to varying degrees, on AI demand roughly validating the capex. If the underlying economics don’t pan out, the currently manageable leverage gets revalued and parent-level downgrade risk could accelerate. The need to understand each issuer and, equally as important, the documents for each individual deal, lend credence to the value of active management.
Index investors naturally accumulate more of the increasingly levered names as they issue new debt. The combination of META, GOOG, AMZN, and ORCL’s combined weight of the primary Bloomberg Corporate index has doubled over the past year to over 4%. However, active management may become an increasing necessity in this environment because the same macro force – growing leverage across the AI complex – leads to a wide dispersion of consequences depending on the debt structure. The structure determines whether the risk taken is a money-good concern or simple mark-to-market along the way.
Credits generally fall into two categories with very different risks. The first group – senior secured debt of hyperscalers – has parent guarantees, so their primary risk is likely a manageable one or two notch rating drift. But for a second group, the unsupported single-asset ABS structure can be the difference between par and impairment.
Group 1: Senior secured debt of the hyperscalers themselves.
For these bonds, default risk is negligible over a reasonable horizon. Risk is rating and spread, rather than a default and loss of capital. The debt for this group of bonds is serviced by the parent company directly rather than an individual data center. These businesses generate hundreds of billions in operating cash flow and are independent of whether any individual facility works out in the end. It is, however, worth monitoring the growth in capex vs cash flow. In 2021 total cash flow of the five hyperscalers was $84B, with 28% of that going to capex. By 2025, cash flow had grown to $161B with capex accounting for roughly half of that. So far this year, capex has grown to roughly 78% of cash flow. Downgrade risk will likely intensify if these expenditures do not start translating into cash flow soon.
Group 2: Project level and securitized paper.
For this group, the risk of principal loss is tied more closely to the success of the actual data center or other project, rather than the finances of the parent company. Single tenant deals, ABS backed by GPU, CMBS, and other similar structures are serviced by the asset and the lease rather than the hyperscaler’s balance sheet. In this structure default and impairment become a much larger factor since you are often dealing with a four-year initial lease term against a 20–30-year financing horizon that is designed to match the life of the building rather than its contents or the lease. Without explicit longer-term tenant credit support and obsolescence, re-leasing becomes the bondholder’s problem.
Disclosure: HB Wealth is an SEC registered investment adviser. The information reflects the author’s views, opinions, and analyses as the publication date. The information is provided for informational purposes only and does not constitute an offer to sell or a solicitation of an offer to buy any investment product. This information contains forward-looking statements, predictions, and forecasts (“forward-looking statements”) concerning the belief and opinions in respect to the future. Forward-looking statements involve risks and uncertainties, and undue reliance should not be placed on them. There can be no assurance that forward-looking statements will prove to be accurate, and actual results and future events could differ materially from those anticipated in such statements. The information does not represent legal, tax, accounting, or investment advice; recipients should consult their respective advisors regarding such matters. Certain information herein is based on third-party sources believed to be reliable, but which have not been independently verified.