Geopolitical risks may weigh on the outlook for stocks in the short run, with the S&P 500 now testing but so far holding a key support level at its 100-day moving average. Events in the Middle East have historically been absorbed fairly quickly by equities, unless oil prices spike and stay elevated. Stocks have been transitioning leadership toward commodity-sensitive sectors and value stocks so far this year, and rising oil prices affiliated with emerging Middle East supply constraints may encourage an extension of this leadership. Broadly, the risk of a market correction given elevated valuations is likely higher than the risk of recession, and oil prices will likely need to rise toward $100 before they upend the domestic economy.
Impact of Middle East Events is Anchored in Oil Signal
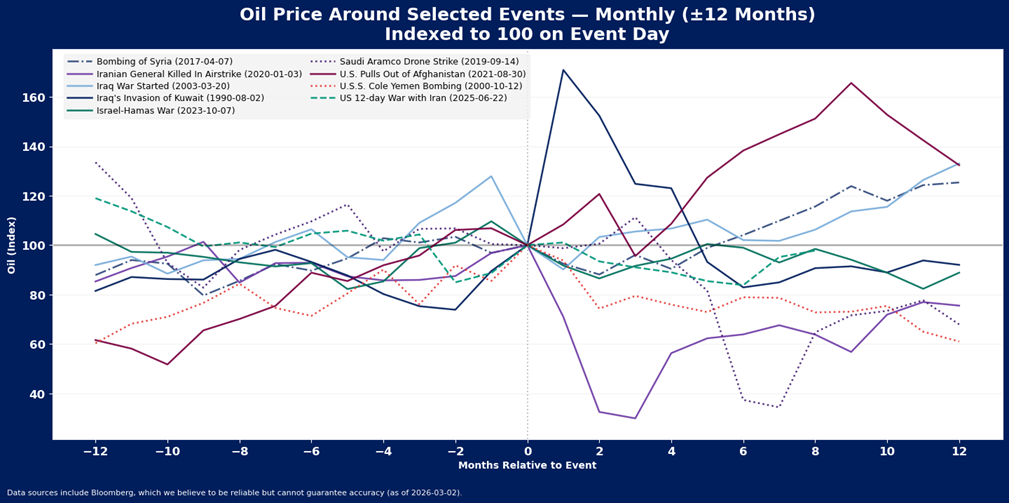
Geopolitical events in the Middle East can be disruptive to equity trends in the short run, but do not usually upend longer term bull markets unless oil prices spike and stay high, thus weighing on earnings and economic growth. We show oil price behavior around nine geopolitical events in the region since 1985 in the exhibit below. On average, oil prices fell 1.6% in the first month after all events, as initial spikes proved fleeting.
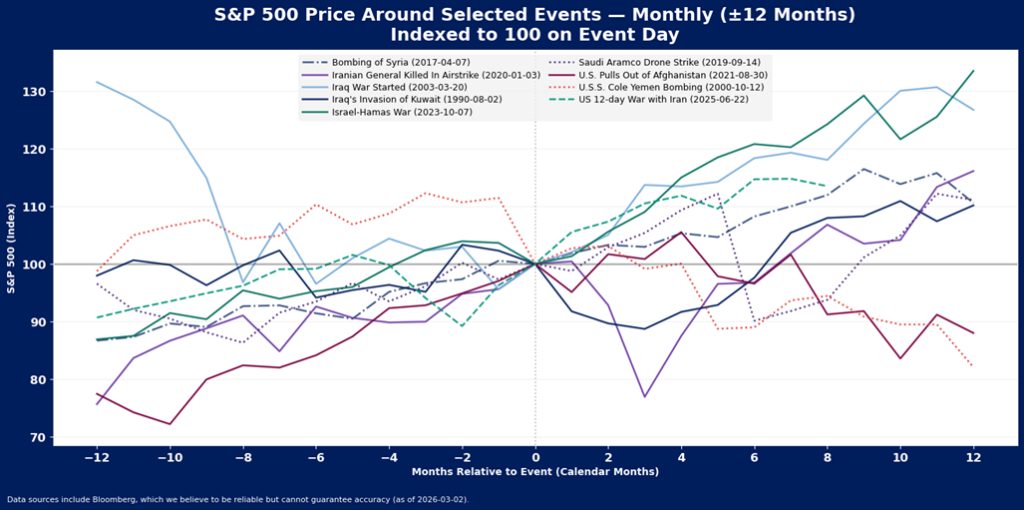
Notably, stocks struggled a bit in the short run but largely shrugged off geopolitical events in the Middle East within a few months. On average, 1-month after all events, stocks were up just 0.2%, but after 12 months, stocks averaged a return of 10.1%. The events were just one of many reasons for markets’ direction, but broadly, stocks were down in the first 6 months after 55.6% of the events. After 12 months, stocks were down after only 25% of these Middle East events.
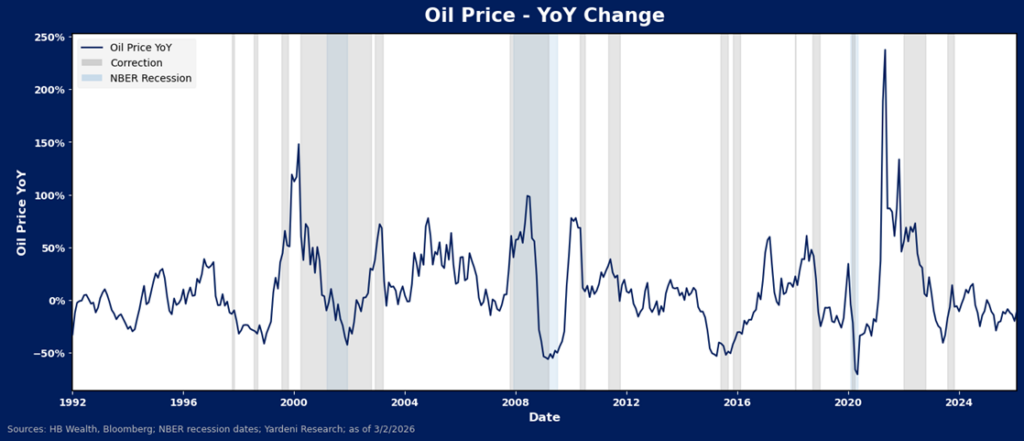
Oil can be a relatively reliable indicator of impending stocks weakness when it surges. Generally, the higher and longer the oil price spike, the worse the experience for equities, even if there is no geopolitical event in the Middle East to spark the rise in oil prices. Notably, each of the recessions in the U.S. economy since the late 1990s (with the exception of Covid) has occurred after jumps in oil price of 50% or more. An elevated price of oil is not always the cause of these recessions, but most certainly contributes to weakness. Likewise, several of the non-recessionary corrections in equity markets – such as 2011, 2018 and 2022 – all occurred after oil price spikes
Watch Pricing Pressure, Rotation and Critical Supports
Supply chain turmoil in general is a risk we will continue to watch, as there is some evidence that supply-based inflation pressures may be emerging again, even without War in the Middle East. As detailed in our note, “Don’t Ignore Inflation Risk in 2026”, from February 6th, producer prices are already running too hot to ignore and imply risks to margin forecasts for non-energy US companies (particularly consumer companies) have emerged. If energy costs continue to accelerate because shipping lanes are closed and/or supply is threatened through attacks, forecasts for earnings growth may dim, taking more wind out of the sails of stocks. Migration toward commodity sensitive, defensive and value-oriented segments may likewise continue as earnings outcomes of this continued pricing pressure become more evident.
As for the market at large, the S&P 500 is losing seasonal support with earnings season now largely in the past, and war in the Middle East may add some degree of downside pressure in the near term. The index is retesting its 100-day moving average, a key level that offered support several times in the market’s recovery from “Liberation Day” last spring. A break of this critical support level, which coincides with the lower bound of the market’s range trade so far this year, could mean more significant short-term loss of momentum for the market. However, as long as the 200-day moving average remains upward sloping and breadth continues to improve, any breakdown should be considered a short-term correction within the longer-term bull trend.
Disclosure: HB Wealth is an SEC‑registered investment adviser. The information reflects the author’s views, opinions, and analyses as the publication date. The information is provided for informational purposes only and does not constitute an offer to sell or a solicitation of an offer to buy any investment product. This information contains forward-looking statements, predictions, and forecasts (“forward-looking statements”) concerning the belief and opinions in respect to the future. Forward-looking statements involve risks and uncertainties, and undue reliance should not be placed on them. There can be no assurance that forward-looking statements will prove to be accurate, and actual results and future events could differ materially from those anticipated in such statements. The information does not represent legal, tax, accounting, or investment advice; recipients should consult their respective advisors regarding such matters. Certain information herein is based on third-party sources believed to be reliable, but which have not been independently verified. Past performance is not a guarantee or indicator of future results; inherent in any investment is the risk of loss.