Trade policy may remain a source of anxiety for markets for some time to come. Contrary to consensus beliefs that tariffs were 2025’s issue, the Supreme Court ruling and resulting new tariff plans from the President suggest uncertainty is back and may challenge market assumptions for robust cyclical recovery in 2026. Renewed near term uncertainty is not because tariffs are higher, but because levels are temporary, and subject to more changes. The President’s immediate reaction to try a different tariff route may be an additional signal to acknowledge. Though tariffs have yet to impact the trade deficit meaningfully, the quick reaction to institute replacement tariffs shows commitment to the tariff cudgel. This may be the bigger source of long-term tension for the economy and financial markets, and as the President continues to double down on tariffs as a mechanism to close the trade gap, it may increase the appeal of non-US investment alternatives.
Tariffs and Trade Pressures on the Rise
The Supreme Court has ruled 2025’s “reciprocal” tariffs, issued under the International Emergency Economic Powers Act (IEEPA), as illegal, reversing many, but not all, of the tariffs put in place last year. Markets initially reacted positively to the ruling, but that reaction was short-lived because the President’s reaction to the ruling injected more policy uncertainty into financial markets. The President announced new tariffs nearly immediately after the ruling, and the replacement solution – for a broad tariff of 10%, perhaps increasing to 15%, to complement still-standing industry-specific tariffs – reduces policy clarity in the short run. The new tariff is issued under Section 122 of the Trade Act of 1974 and must be ratified by Congress after 150 days.
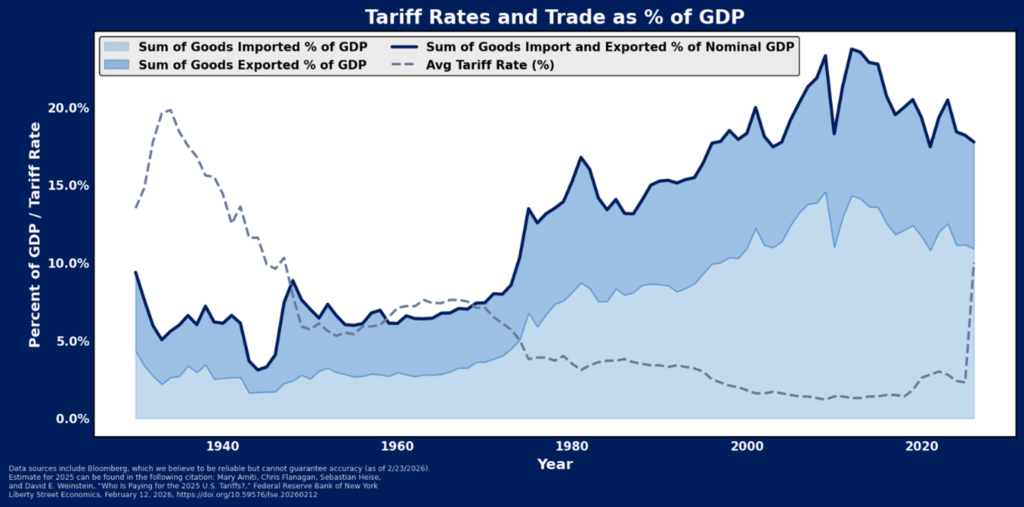
The tariff level itself is only marginally different than the average tariff already in place in aggregate, though it does reduce the pricing pressure on products coming from countries like China, India and Brazil, where rates were significantly higher than average. Overall, tariff policies implemented in 2025 resulted in the highest average tariff rate on US goods since 1941. The average tariff rate reached 16% last year, up seven-fold from its multi-decade low of 1.2% reached in 2008. Though the new tariff rate (plus industry specific tariffs) may not be materially higher than before, it is uncertain and subject to future change, and this is one source of discomfort for markets. Additional options for industry and country-targeted tariffs could also still emerge, perhaps dependent on Congress’ take on the new across-the-board rate.
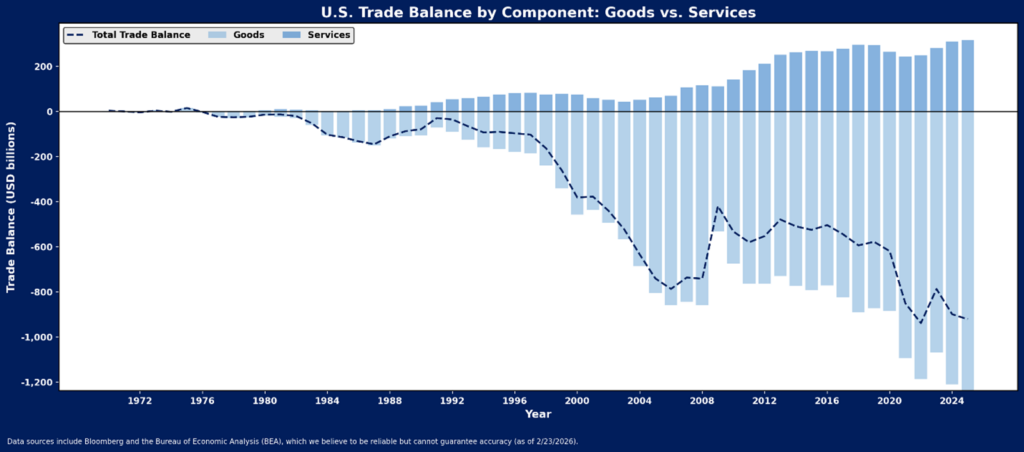
However, we also found out last week that the US trade deficit didn’t budge with the weight of tariffs last year. This may be the bigger problem.
The President’s stated intention with tariffs is to stimulate domestic onshoring, production and jobs via trade deficit adjustment. However, this adjustment process is so far slow in coming. Last year, despite the tariffs, US companies continued to import just as much as they did in 2024, with the total amount of goods imports at $3.35 trillion in 2025 versus $3.27 trillion in 2024. This stubbornly wide deficit indicates little change in the behavior of US or international companies has yet emerged from trade policy shifts. And while that may suggest to some that the tariffs have been ineffectual, that does not appear to be the case with the President. Instead, the President appears more likely to double down on tariffs. His commitment to rebalance the trade deficit via tariffs became even more evident with his response to the Supreme Court ruling. If we are correct in this interpretation, tariffs may keep getting higher, rather than lower. Ever higher tariffs are almost assuredly not “in the price”, particularly after post-liberation day reversals.
What Will It Mean for Asset Prices?
The renewed climate of tariff uncertainty has already resulted in market volatility and may also result in a reversal of some of the leadership shift that emerged in the stock market in recent months. Small caps and equal weighted large caps have outperformed large cap stocks since their November lows, partly on the premise that US cyclical recovery is emerging, and partly on the presumption of a more certain operating environment. But those smaller cap, value-oriented cyclical groups do not have exports to offset import uncertainty, nor the pricing power to generally pass along changes in import costs. Until some clarity emerges regarding Congress’ impression on the President’s new tariff agenda, presumptions of growth for domestic cyclicals may be challenged.
Longer term, a more volatile policy landscape emerged with trade policy shifts in the US in 2025, and that challenging policy landscape appears likely to persist. This may continue to result in better performance for nondomestic assets, particularly as the rest of the world seems even more committed to trade with one another via expanding trade pacts and agreements. Presumptions that the US market will remain the most investor and business friendly are challenged with trade policy volatility, and capital may continue to diversify to other global areas of stability as a result.
Disclosure: HB Wealth is an SEC-registered investment adviser. The information reflects the author’s views, opinions, and analyses as the publication date. The information is provided for informational purposes only and does not constitute an offer to sell or a solicitation of an offer to buy any investment product. This information contains forward-looking statements, predictions, and forecasts (“forward-looking statements”) concerning the belief and opinions in respect to the future. Forward-looking statements involve risks and uncertainties, and undue reliance should not be placed on them. There can be no assurance that forward-looking statements will prove to be accurate, and actual results and future events could differ materially from those anticipated in such statements. The information does not represent legal, tax, accounting, or investment advice; recipients should consult their respective advisors regarding such matters. Certain information herein is based on third-party sources believed to be reliable, but which have not been independently verified. Past performance is not a guarantee or indicator of future results; inherent in any investment is the risk of loss.