Stocks Bull Charge May Slow its Pace in 2026

A person stands on a mountain peak, looking over blue hills. Text reads: Market Sense by HB Wealth. Stocks Bull Charge May Slow its Pace in 2026. January 9, 2026.
Bar chart showing forward 12-month returns based on fair value signal. When Fair Value PE > S&P 500 PE, mean return is 9.3%, median is 12.5%. When Fair Value PE ≤ S&P 500 PE, mean is 3.1%, median is 5.0%.

Our macro model for S&P 500 valuations shows multiples have jumped too far ahead of macroeconomic support and this may slow the pace of index price growth in the near term. This model suggested markets were largely undervaluing low interest rates for most of the last two decades, supporting the case for multiple expansion and robust price growth. Now it suggests that the market is overvalued. The last time our valuation model fell this far short of the market was during the tech bubble, but the model also shows stocks’ valuation excess is quite small by comparison to that time.

Valuations are notoriously poor timing tools and thus should be just one component of a decision process. Nonetheless, our model for valuations suggests a slower growth landscape for stocks may be set to emerge in the year ahead. Based on current consensus expectations for the 2-year and 10-year Treasury yields, as well as forecasts for earnings growth to rise about 14% per year for the next two years, our regression model for US large cap stocks suggests the S&P 500 should trade closer to 19X earnings versus its current P/E ratio of about 22x. 

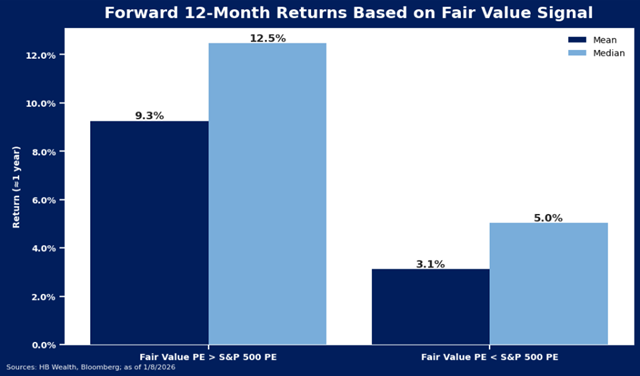
Since 1999, in periods when the market P/E was below our model estimate, forward 12-month returns for the market averaged 9.3%, and the median return was 12.5%.  Over 40% of the market return in these periods came from valuation expansion. Now that the market has gotten ahead of the model estimate, it implies lower expected returns for stocks. Or, at least, returns that are more dependent on earnings growth than on valuation expansion. Over the last 26 years, when the market PE was above our modeled PE, the market return averaged 3.1% and valuation expansion accounted for slightly less (35%) of the return during those periods.

Line chart showing the difference between Fair Value PE and S&P 500 Market Cap PE from 2000 to 2025, with fluctuations above and below zero and peaks around 2020. Data source: H8 Wealth, Bloomberg.

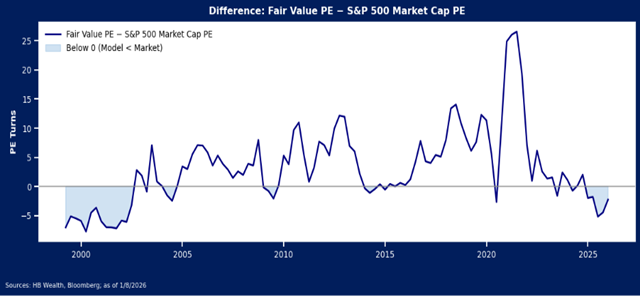
While 2025’s excess is still modest by comparison, the only other extended period when the combination of bond yields and earnings growth undershot market multiples was during and just after the turn of the century tech bubble. At that time, the model undershot market multiples for several consecutive years, and by a much larger margin. Our model suggested the market was overvalued from March 1999 to June 2002, or 39 months, and by up to 7.7 turns. At max this time, our model suggested the market was 5.2 turns overvalued, and the model has hinted at excess valuation for the last 15 months.

Prior to this past year, the market only became overvalued by comparison to its macro supports for brief stretches, and excess valuation was minimal. This mandated an optimistic outlook for valuation expansion to contribute to price appreciation. The model now suggests valuations are a risk to stocks. Thus, multiples may be more likely to compress to align with the rates landscape, effectively slowing down the pace of the bull charge in stocks in the year ahead.

Disclosure: The information reflects the author’s views, opinions, and analyses as the publication date. The information is provided for informational purposes only and does not constitute an offer to sell or a solicitation of an offer to buy any investment product. This information contains forward-looking statements, predictions, and forecasts (“forward-looking statements”) concerning the belief and opinions in respect to the future. Forward-looking statements involve risks and uncertainties, and undue reliance should not be placed on them. There can be no assurance that forward-looking statements will prove to be accurate, and actual results and future events could differ materially from those anticipated in such statements. The information does not represent legal, tax, accounting, or investment advice; recipients should consult their respective advisors regarding such matters. Certain information herein is based on third-party sources believed to be reliable, but which have not been independently verified. Past performance is not a guarantee or indicator of future results; inherent in any investment is the risk of loss.

A woman with long brown hair wearing a blue blazer and a necklace smiles at the camera. The background is softly blurred with light and blue tones.

Gina Martin Adams, CFA, CMT

Chief Market Strategist, Shareholder

Gina Martin Adams, CFA, CMT, is the Chief Market Strategist for HB Wealth. With more than 25 years of experience at leading global financial institutions, Adams brings deep expertise in market analysis, thematic research, and translating complex economic trends into actionable strategies. She collaborates with HB Wealth’s investment team to deliver timely market perspectives, share actionable insights, and enhance the firm’s visibility as a leading voice in the industry. She contributes to advancing proprietary research, supporting the development of new investment products, and enhancing the client experience through thought leadership and education. She pursues a top-down perspective and model-based approach, leveraging fundamental, technical, and quantitative perspectives to inform investment decisions, and frequently presents her views in the media and at industry conferences, professional associations and investment organizations.

A young man with short brown hair, wearing a dark suit, white shirt, and blue tie, stands in front of a blurred background with lights and blue tones.

Matthew Sanders

Senior Investment Research Analyst

Related Insights & News

A person stands on a mountain ledge overlooking blue mountain ranges under a clear sky. Text reads, Market Sense by HB Wealth: The Tariff Beatings May Continue Until the Trade Deficit Improves. February 24, 2026.

The Tariff Beatings May Continue Until the Trade Deficit Improves

Trade policy may remain a source of anxiety for markets for some time to come….

Read More

A person stands on a mountain peak overlooking layers of blue hills, next to a blue panel with text: Market Sense by HB Wealth. Revenue Cue Has Large Cap and Small Cap Stocks Trading Places. February 20, 2026.

Revenue Cue Has Large Cap and Small Cap Stocks Trading Places

Earnings season is normally an uplifting experience for the S&P 500, but that has not…

Read More

A person stands on a rocky outcrop overlooking mountains under a blue sky. On a blue panel, text reads: Market Sense by HB Wealth. Industrials are Partying Like its 1999. February 19, 2026.

Industrials are Partying Like its 1999

Recent data on durable goods orders and industrial production suggest an industrial recovery may be…

Read More

A person stands on a mountain ledge overlooking blue hills. Text reads: Market Sense by HB Wealth. U.S. Large Caps Have a Problem of Extraordinary Expectations. February 18, 2026.

U.S. Large Caps Have a Problem of Extraordinary Expectations

Recent rotation has helped resolve some of U.S. large cap stocks’ valuation excesses, but risks…

Read More

The above is not a recommendation to purchase or sell a particular security and is not legal, investment or tax advice. Results are not guaranteed. All investing involves risk.

Past performance is not a guarantee of future results for any investment. Private alternative investments are not for every client. An individual must be qualified to invest in a private investment based on their net worth and/or other criteria, and they may qualify to invest in some alternative investments while not being allowed to invest in other alternative investments. Alternative investments are not risk-free and there is no guarantee of achieving attractive performance compared to similar liquid investments. Risks associated with investments in private alternatives include the illiquid nature of such investments, risks associated with leveraged investments, manager-specific risks, sector-specific risks, and in certain cases geographical risk, as well as the risk of loss of principal.