


Stocks rallied on welcome news of another round of liquidity provision and brightening growth from the Federal Reserve last week, only to unwind the trade (and then some) in recent days. Our valuations Model suggests the equity market may continue to struggle to see a few more Fed cuts as reason to push market multiples to new highs, implying the market outlook will be more reliant on earnings trends in 2026. Meanwhile, a look beneath the hood to examine the drivers of valuation reveals that rotation could help ease valuation risks to the U.S. equity market.
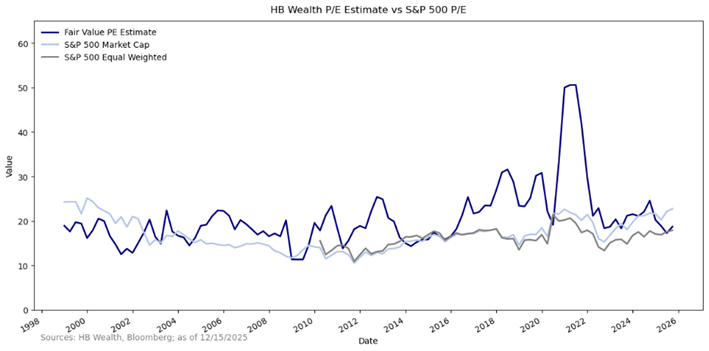
Rates alone aren’t likely to head low enough to support current equity valuations, and will need support from a robust earnings outlook to keep stocks’ multiples afloat in the year ahead. U.S. large cap equity P/E is hovering near levels last recorded in 2021, when short-term interest rates were near zero and 10-year Treasury yields were less than 2%. Based on current consensus expectations for the 2-year Treasury rate to hit 3.3% and the 10-year Treasury yield to be 4.1% in a year, as well as forecasts for earnings growth to rise about 14% per year for the next two years, our regression model for US large cap valuations suggests the S&P 500, trading at 22.5x earnings, is about 4 turns too rich.
Valuations are notoriously difficult to model with macro variables alone and are very poor timing mechanisms for stocks to boot, so multiples are just one piece of the puzzle of markets to consider. However, the recent divergence between the macro model and the market reality is worth exploring because this macro model struck an optimistic tone for equity markets for most of the last two decades. For most of the recent past, macro cues suggested equity multiples should be higher than observed. Indeed, prior to this past year, the only other extended periods in time in which the combination of bond yields and earnings growth undershot market multiples was during and just after the turn of the century tech bubble and in the mid-cycle correction of 2015-16.
Notably, as valuations for the market cap weighted index overshot our fair valuation model estimate, the equal weighted index has continued to trade at a discount to implied fair valuation, suggesting the valuation excess is concentrated in high-priced large market cap stocks. On an equal-weighted basis, stocks trade at 18 times earnings, still a touch below what the bond market and earnings trends together imply is fair valuation. This valuation gap may suggest the Magnificent-7 (Mag-7) has now emerged as a significant risk to stocks, but it also hints that there remain valuation discounts hidden beneath the heavy weight of this dominant group.
The evolution of the gap between market-cap weighted and equity weighted valuations is important to acknowledge, for it may offer hints as to what may trigger valuation normalization. The gap is largely explained by the Mag-7, and fundamental performance of this group in contrast to the rest of the index.
In recent years, Mag-7 stocks started recording both abnormally strong earnings and notably large earnings beats, particularly as the rest of the index experienced unusually weak earnings conditions. On average since 2023, the Mag-7 has recorded more than 30% earnings growth, and the Mag-7 stocks have managed to top earnings expectations each year since 2023. This Mag-7 growth phenomenon has occurred as the rest of the index has struggled to produce even average growth while continuing to miss consensus. On average, the ex-Mag-7 has recorded earnings growth of just 3% since 2023, and the last time ex-Mag 7 stocks beat forecasts was in 2021.
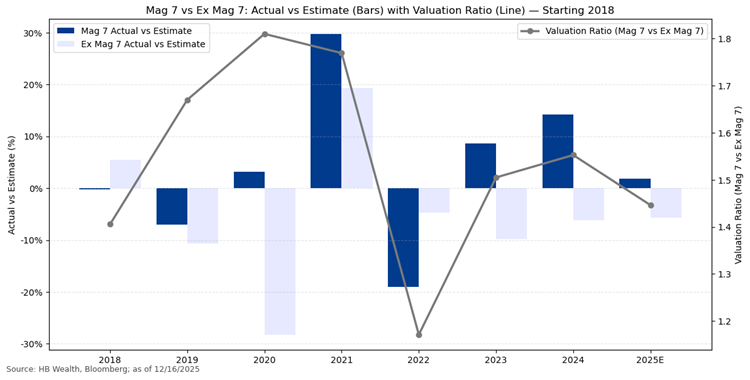
Given this valuation phenomenon, the outlook for S&P 500 valuations may depend less on a few more cuts from the Fed, and more on the degree to which earnings trends shift. To sustain elevated valuations and justify the gap between market cap weighted and equal weighted valuations, the Mag-7 group likely needs to keep topping forecasts and producing growth well above the rest of the index. In contrast, the valuation gap may close with Mag-7 misses and/or better growth emerging from the rest of the index. Currently, the consensus sees Mag-7 earnings growth of 18.1% in 2026. While this is slower than the pace in recent years, it is still 1.3x faster than the rest of the index, which is projected to grow earnings 13.5%. Meanwhile, the rest of the index may have an opportunity to shine, if they can recover stronger growth, and especially if they manage to beat expectations for the first time since 2021.
Disclosure: The information reflects the author’s views, opinions, and analyses as the publication date. The information is provided for informational purposes only and does not constitute an offer to sell or a solicitation of an offer to buy any investment product. This information contains forward-looking statements, predictions, and forecasts (“forward-looking statements”) concerning the belief and opinions in respect to the future. Forward-looking statements involve risks and uncertainties, and undue reliance should not be placed on them. There can be no assurance that forward-looking statements will prove to be accurate, and actual results and future events could differ materially from those anticipated in such statements. The information does not represent legal, tax, accounting, or investment advice; recipients should consult their respective advisors regarding such matters. Certain information herein is based on third-party sources believed to be reliable, but which have not been independently verified. Past performance is not a guarantee or indicator of future results; inherent in any investment is the risk of loss.

