


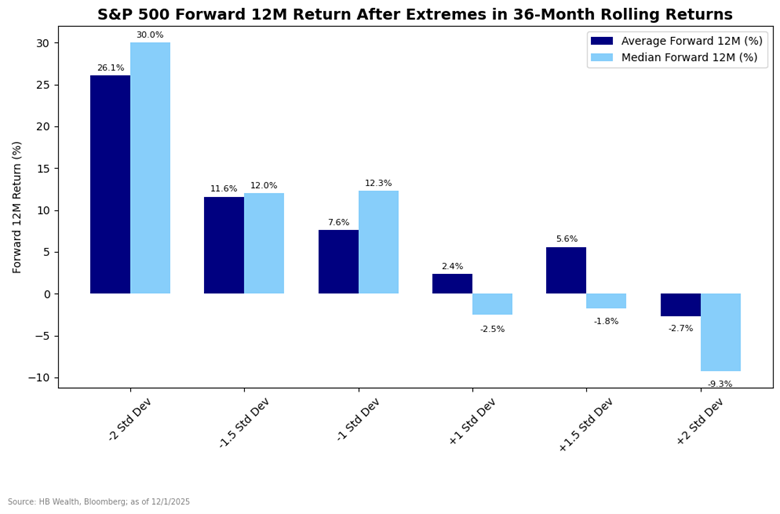
The S&P 500’s 36-Month Rolling Return neared 2 standard deviations from norm in September. The chart below shows what historically happened after extremes were reached in the measure. The more extreme the deviation, the lower the return prospects.
Likewise, such extreme deviations above norm generally lower the probability of a positive return in the forward 12 months. The index was higher about 40% of the time after at least a standard deviation surge beyond norms, while it was higher more than 75% of the time after a drop of at least a standard deviation.
HB Wealth is an SEC Registered Investment Adviser and the information provided is for informational purposes only. Additionally, the information should not be construed as investment advice or a recommendation to buy or sell any security or other financial instrument. Past performance is not indicative of future results. Investing involves risk, including the possible loss of principal. The views expressed are those of the author and do not necessarily reflect the opinions of HB Wealth. Please consult your financial advisor before making any investment decisions.

