


Market Sense
By:


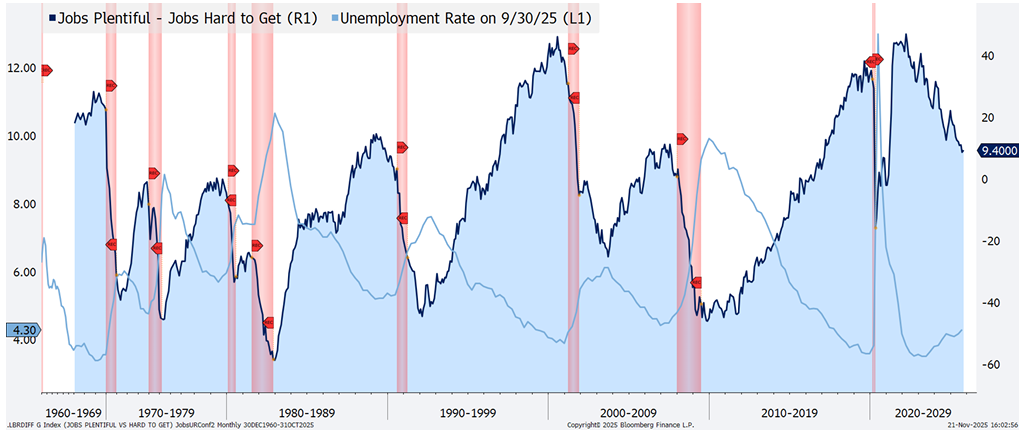
The jobs market has signaled a weak economy for years, even as other indicators such as corporate profits suggest the economy is holding up reasonably well. This may help explain why consumer confidence remains near record low levels, even as the stock market is at record highs.
The unemployment rate has been on the rise since mid-2023, and now stands at 4.4%, 60 basis points above its record low reached more than two years ago. There is no other instance in history since 1960 in which the unemployment rate rose for two years outside of recession. Prior to 1990, recessions were largely coincident with the start of the rise in unemployment, but since then, the rate rose an average of 9 months and by 35 basis points from its low by the time recession was underway.
Likewise, the Conference Board’s Consumer Confidence survey shows that “Jobs Hard to Get” has been gathering momentum relative to “Jobs Plentiful” since early 2022. While the differential between the two series is still positive, the directional change of the difference has historically been a more accurate cue for recession timing. On average, recessions have emerged within 8 months of peaks in the difference.
HB Wealth is an SEC Registered Investment Adviser and the information provided is for informational purposes only. Additionally, the information should not be construed as investment advice or a recommendation to buy or sell any security or other financial instrument. Past performance is not indicative of future results. Investing involves risk, including the possible loss of principal. The views expressed are those of the author and do not necessarily reflect the opinions of HB Wealth. Please consult your financial advisor before making any investment decisions.
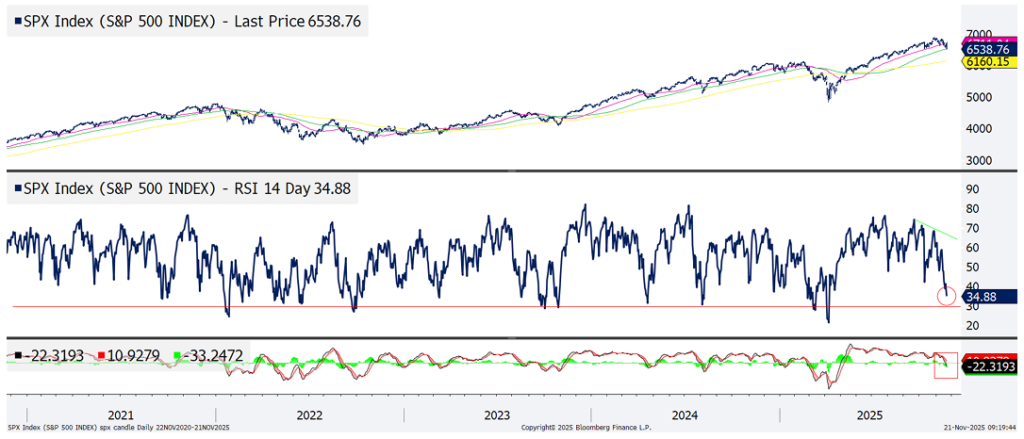
The longer-term equity bull market remains intact, supported by S&P 500 moving averages that are still trending higher, but stocks’ short term sell-off looks likely to deepen nonetheless. Momentum, represented by 14-day RSI, is not yet oversold and MACD (moving average convergence divergence) has just crossed into negative territory, hinting at a deeper correction emerging. Typically, 14-day RSI needs to reach the 30 level before short term corrections are complete in the index. Notably, momentum non-confirmations (RSI failed to rise with price) throughout October, correctly signaling a correction coming in November.
HB Wealth is an SEC Registered Investment Adviser and the information provided is for informational purposes only. Additionally, the information should not be construed as investment advice or a recommendation to buy or sell any security or other financial instrument. Past performance is not indicative of future results. Investing involves risk, including the possible loss of principal. The views expressed are those of the author and do not necessarily reflect the opinions of HB Wealth. Please consult your financial advisor before making any investment decisions.
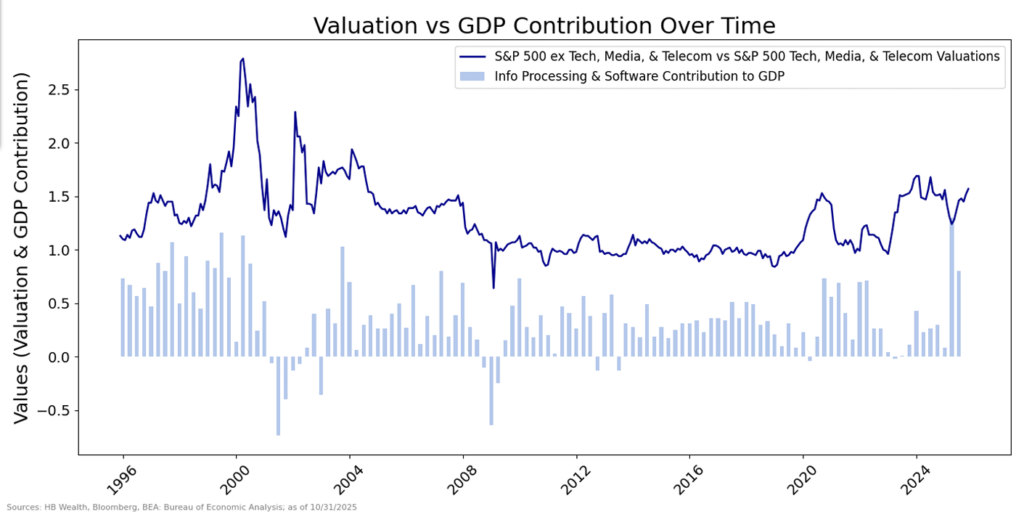
The equity market is enthusiastic about prospects for AI spending to remain a primary driver of earnings growth, and while a cooldown in valuations may be needed to keep expectations from getting too far detached from reality, both investment trends and stock multiples are less extreme than they were in the turn of the century tech bubble in the U.S. Contrary to the years-long tech capex extremes during the 1990s, AI-related spending may just be getting started, and valuations remain well below those bubble-era peaks.
While valuations for large cap AI-focused tech stocks are high relative to much of the recent past, their premium to the rest of the market remains limited compared to the premium that developed in the late-1990s tech boom. U.S. large cap tech and communications stocks trade at a trailing P/E multiple of 34.7x – high compared to their post-pandemic average of 28.3x, but still only about half the peak multiple reached in 2000. Now valued at 1.5 times the rest of the S&P 500, the group traded at 2.8 times their large cap counterparts in 2000. Likewise, the 4 major “AI Hyperscalers” – Microsoft, Alphabet, Meta and Amazon – trade at an average 30.3 times trailing earnings, a far cry from the 80X level the “Four Horsemen” – Cisco, Microsoft, Dell and Intel – traded to by 2000.
Meanwhile, investment has packed a stronger punch to GDP, but it has been underway for a much shorter time than the buildup to the tech bubble. On average over the last 20 years, investment accounted for 0.31 percentage points of growth in GDP quarterly, but in the first half of 2025 it averaged more than a full percentage point of growth, comparable to the norms last set in the late 1990s. The 1990s high level of investment contribution went on for 4 years, however, where the AI-capex boom has been arguably only become extreme for the last few quarters.
The “AI-Hyperscalers” are in aggregate on track to spend around $380 billion in 2025, and have committed to spending $1.7 trillion by 2030, suggesting investment is likely to remain a robust contributor to economic growth. Until these entities signal a significant slowdown, enthusiasm is likely to remain. And as AI-investment among the few morphs into AI-utilization among the many, the AI-theme may continue to offer ballast to profits and support high expectations embedded in stock markets.
HB Wealth is an SEC Registered Investment Adviser and the information provided is for informational purposes only. Additionally, the information should not be construed as investment advice or a recommendation to buy or sell any security or other financial instrument. Past performance is not indicative of future results. Investing involves risk, including the possible loss of principal. The views expressed are those of the author and do not necessarily reflect the opinions of HB Wealth. Please consult your financial advisor before making any investment decisions.
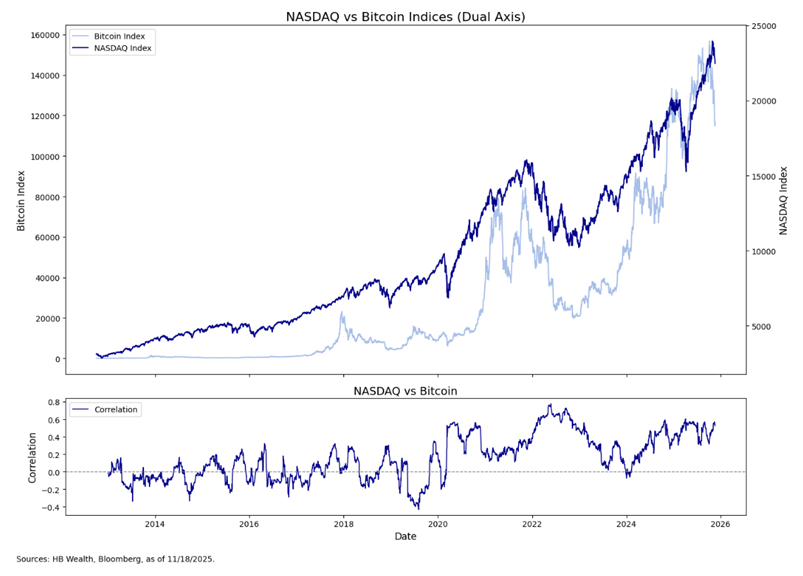
Bitcoin is down more than 25% from its peak in early-October, and this doesn’t bode well for U.S. tech stocks, which have dropped less than 6%. If past proves precedent, and unless Nvidia can revive confidence with their earnings report tomorrow, US tech could be due for a bigger decline yet to come.
Bitcoin has posted its worst 5-week decline since December 2021, and a continued drop in the cryptocurrency may weigh heavily on U.S. tech stocks. Contrary to its sporadic relevance to stocks in the decade prior to 2020, bitcoin’s correlation with and fundamental link to the stock market has grown more persistent in the post-pandemic environment. The cryptocurrency’s 40-day correlation with the Nasdaq has been positive since 2020, with only a brief exception in 2024. Past corrections in bitcoin of more than 25% do not always cause major strain for stocks, but two of them occurred in tandem with major risk-off periods in 2021 and 2024. Crypto tops in 2021 and 2024 led to significant short-term tops in the Nasdaq and broader US equity markets.
Notably, the link between bitcoin and US equities is more than purely technical in nature, as US companies have increasingly added bitcoin onto their balance sheets. With those now subject to swings in bitcoin, the tie between cryptocurrency and stocks may remain relatively strong.
HB Wealth is an SEC Registered Investment Adviser and the information provided is for informational purposes only. Additionally, the information should not be construed as investment advice or a recommendation to buy or sell any security or other financial instrument. Past performance is not indicative of future results. Investing involves risk, including the possible loss of principal. The views expressed are those of the author and do not necessarily reflect the opinions of HB Wealth. Please consult your financial advisor before making any investment decisions.