


Market Sense
By:


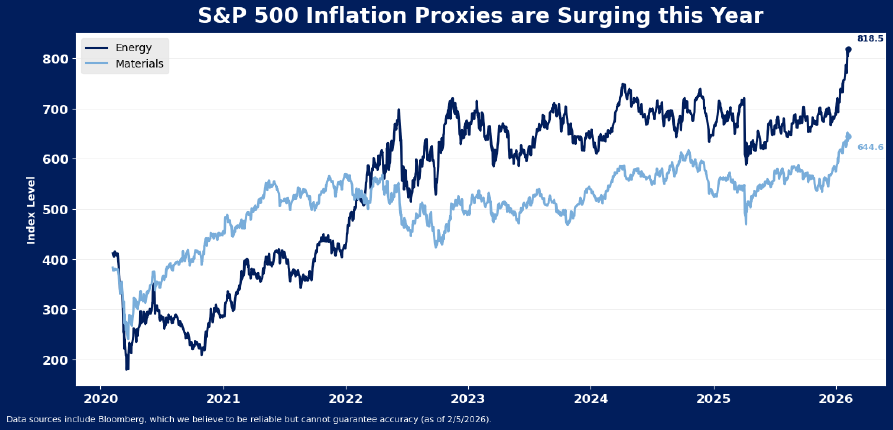
Elevated fiscal spending, easy monetary policy, trade tensions and geopolitical strains may imply inflation risk is re-emerging in 2026. This could take consensus views, focused more squarely on potential job losses as AI-initiatives are implemented, off guard this year. Materials and energy are two of the top performing sectors in large cap stocks year-to-date, as commodity prices surge. Services companies, in particular, are reporting elevated prices. Historically, inflation is only problematic for stocks in two instances – (1) when consumer prices accelerate faster than 3.5%, and (2) when producer prices rise faster than consumer prices. Consumer prices are not rising so quickly that they are likely to compress market valuations (tech stocks are doing that job quite nicely anyway!). However, producer prices are now rising faster than consumer prices. This suggests the profits outlook may be more troubled than is commonly believed.
While in the intermediate term, there may appear little risk of a broad inflation breakout, a few indicators are starting to flash yellow with respect to inflation. Notably, energy and materials stocks are having their best start to the year in some time, as the combination of monetary and fiscal easing in 2025 may be starting to impact pricing and activity in 2026. Both sectors recorded their strongest 1-month gains in January since October 2022 and June 2023, respectively.
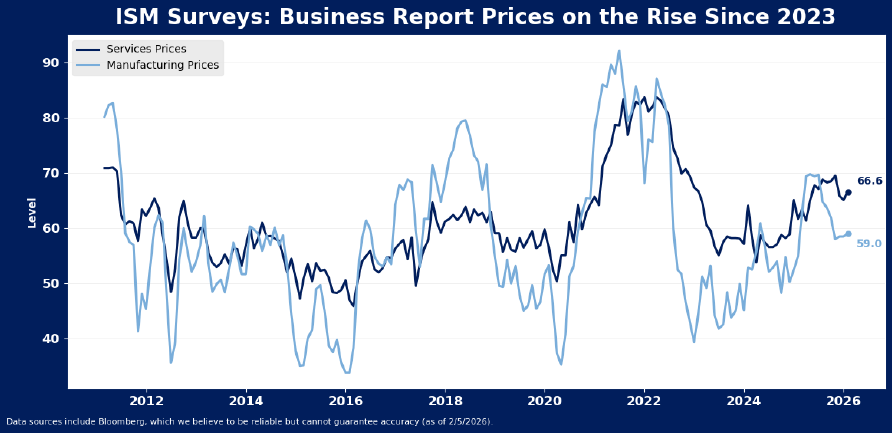
Meanwhile, businesses report services prices remain elevated. Though both services and goods prices have been slowly increasing from their 2023 lows for more than two years, services costs are still higher than any point in the pre-pandemic cycle. All 17 industries in the ISM services index reported an increase in prices paid in January, suggesting remarkable breadth in pricing pressure for services.
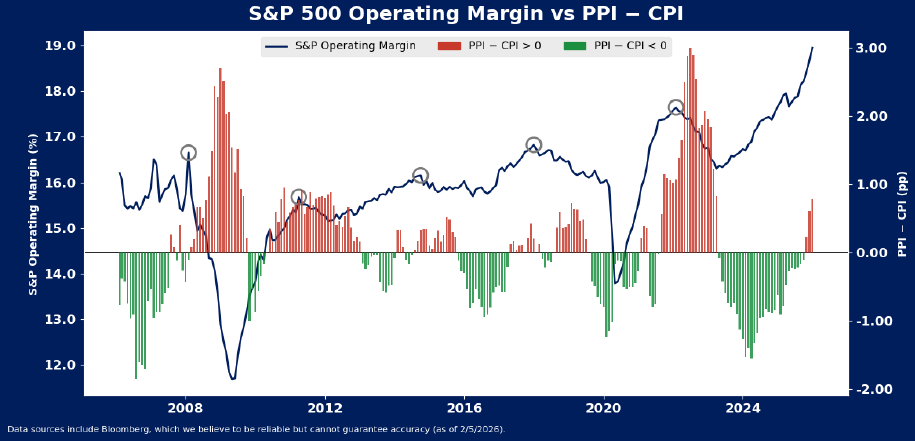
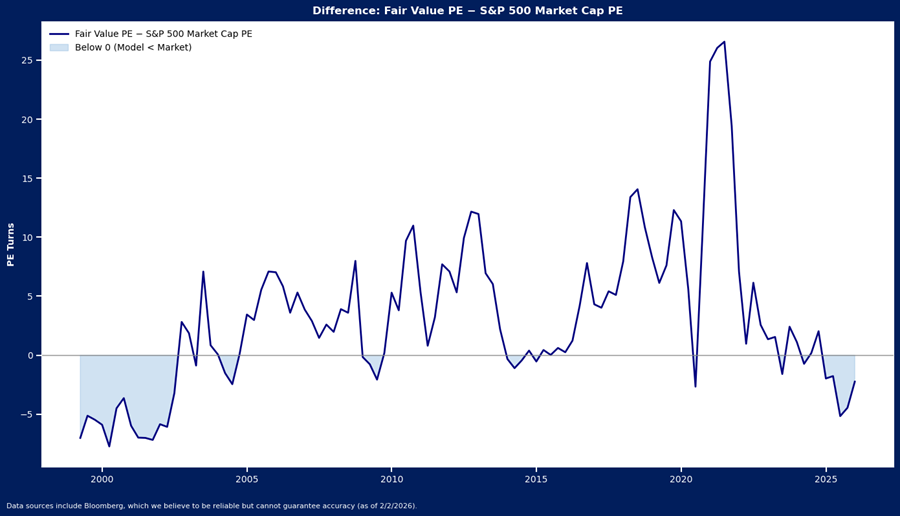
And importantly, the spread between producer and consumer prices is suggesting pricing pressure may be starting to emerge, and this may throw a bit of cold water on margin forecasts for the S&P 500. The spread between these indicators can operate as a proxy for company pricing power. Historically, when core producer prices accelerate faster than core consumer prices, particularly when producer price growth is above 3%, companies struggle to pass along costs. This struggle manifests in margin weakness for S&P 500 companies.
Our chart shows the spread plotted against index margins over time. Each time PPI accelerated faster than CPI, index margins reached a near term peak. This last happened in 2022, but it also happened in 2018, 2015 and 2011. In each period, markets weakened for various reasons, but in all periods, profitability of U.S. companies slumped a bit under the pressure of elevated inflation.
These inflation signals should be watched carefully as the year progresses, for it is early to suggest inflation is yet a problem for stocks. Pricing issues may need to deepen before they become a major drag on stocks or trouble the economy. From a broad perspective, stocks valuations usually do not react to inflation pressures until CPI accelerates beyond 3.5%. This reflects the historical tendency for the Fed to allow inflation to run slightly hotter than the loose 2% stated target. Over the long run, CPI has averaged 3%, and equity market valuations average north of 20X when inflation is below 3.5%, as is still the case. Above 3.5%, the market has historically experienced a material downdraft in valuations.
Disclosure: HB Wealth is an SECregistered investment adviser. The information reflects the author’s views, opinions, and analyses as the publication date. The information is provided for informational purposes only and does not constitute an offer to sell or a solicitation of an offer to buy any investment product. This information contains forward-looking statements, predictions, and forecasts (“forward-looking statements”) concerning the belief and opinions in respect to the future. Forward-looking statements involve risks and uncertainties, and undue reliance should not be placed on them. There can be no assurance that forward-looking statements will prove to be accurate, and actual results and future events could differ materially from those anticipated in such statements. The information does not represent legal, tax, accounting, or investment advice; recipients should consult their respective advisors regarding such matters. Certain information herein is based on third-party sources believed to be reliable, but which have not been independently verified. Past performance is not a guarantee or indicator of future results; inherent in any investment is the risk of loss.
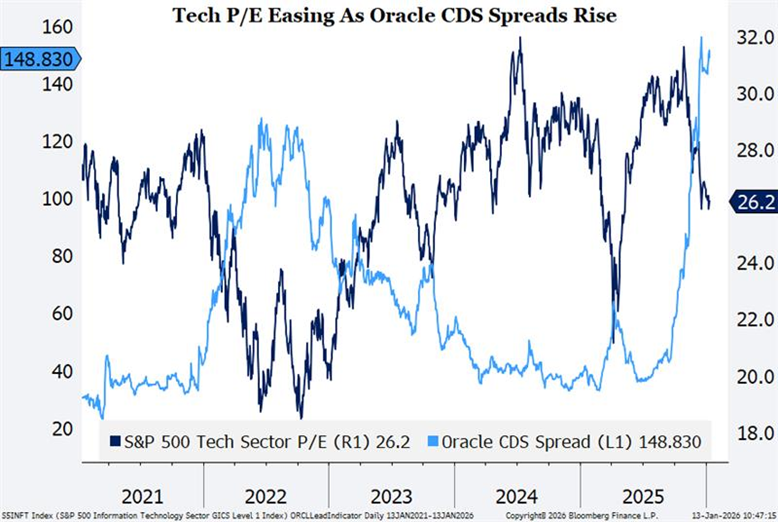
U.S. equity markets’ rotation out of technology has come a long way over the last few months, and the sector is now trading at just a 10% premium to the rest of the market. The sector’s earnings may justify a modest premium to the index, but only if growth can remain very strong. If relative earnings momentum fades as the consensus expects, it may suggest more valuation pressure for the group, and if valuations for tech – the largest sector in the index by market cap – stall or fall, a continued struggle for stocks is likely. Over the long run, the S&P 500 posts stronger returns in periods when tech stocks’ multiples are rising, and that seems unlikely as unusual post-pandemic economic trends normalize.
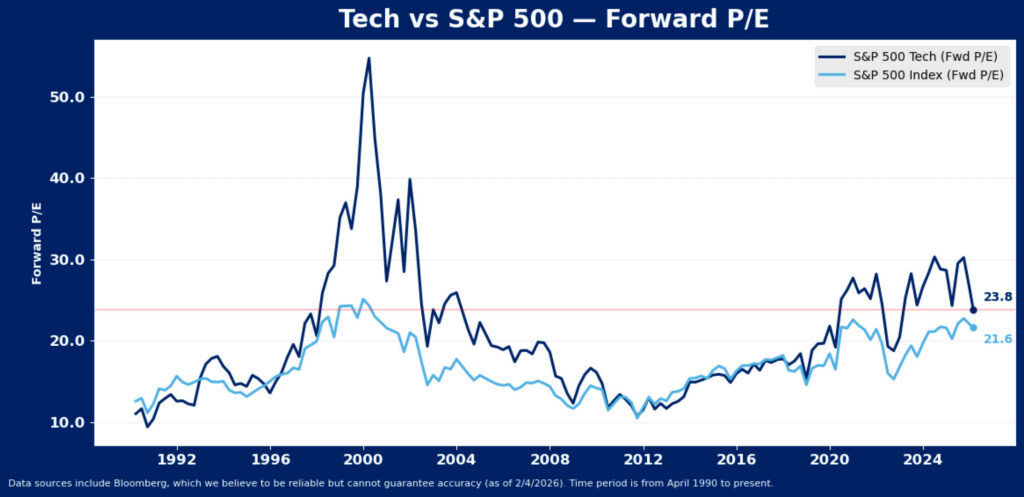
After leading the S&P 500 with a rally of more than 70% from the spring 2025 low to the October 2025 high, tech stocks have sold off 11.5%, pushing the sector’s forward P/E multiple back to 23.6x from its peak above 30X. This is still higher than 86% of history back to 1990, and comparable to levels recorded in 2002, as the tech bubble was in the process of deflating. However, it has started to close the sector’s valuation gap to the rest of the index. The former 40% tech premium has been cut to 10%, but it is still above ex-bubble norms – tech has historically traded in line with the index except during the tech bubble and during the AI-craze. Notably, the premium developed during the tech bubble reached significantly higher extremes and took years to normalize. Tech’s premium is much lower this time but is nonetheless still creating some tumult for stocks as it normalizes.
Loss of momentum in the AI trade that powered tech to new high valuations is the culprit behind the latest decline, in similar fashion to the same issue that plagued tech in early 2025. However, back then, tech sector valuations recovered smartly because tech earnings growth proved more resilient than the rest of the index. Tariffs, while less onerous than anticipated, effectively stalled out the budding recovery in the rest of the index in 2025 while tech enjoyed another leg of AI investment-led growth. With tech proving a reliable growth engine, particularly by comparison, capital pushed back into the segment, elevating valuations.
Neither of these trends – tariffs stifling ex-tech growth or tech getting another leg up from AI – appears likely to emerge this year. Ex-tech earnings growth is expected to continuously accelerate this year as tech earnings growth hits a peak in the current quarter.
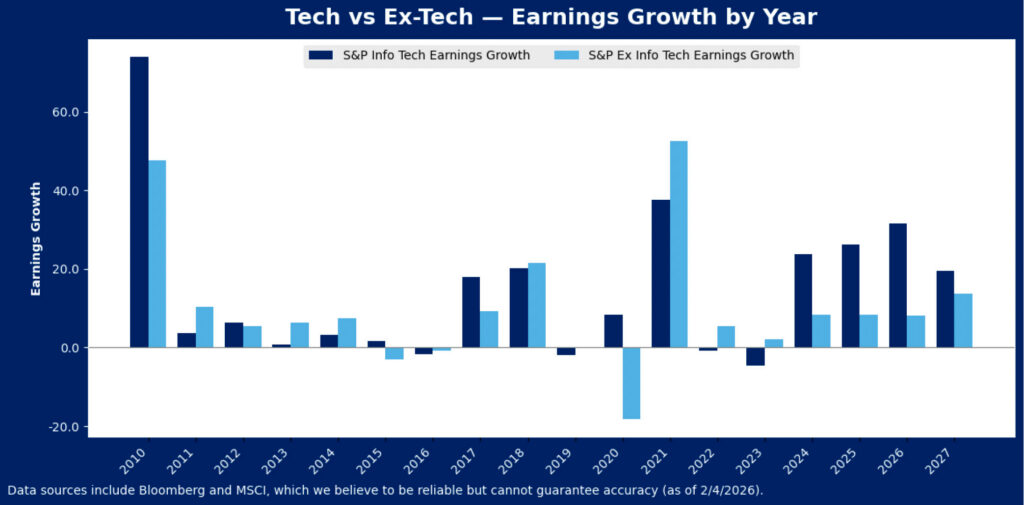
This may mean tech sector valuations will continue to stall out. During the period between the financial crisis and pandemic, tech sector earnings growth was about 20% faster than ex-tech sectors of the S&P 500 on average. Since the pandemic, tech’s earnings growth has been 50% stronger than the rest of the index, with average annual growth of 15.1% since the end of 2020 compared to ex-tech’s average growth of 9.8%. The tech growth phenomenon resulted in valuation expansion for the group, as ever-stronger earnings growth was continually experienced, and extrapolated. The consensus now sees a smaller growth premium as likely to start to emerge this year and next. If this proves correct, the premium that has become the norm in the post-pandemic world is no longer justified.
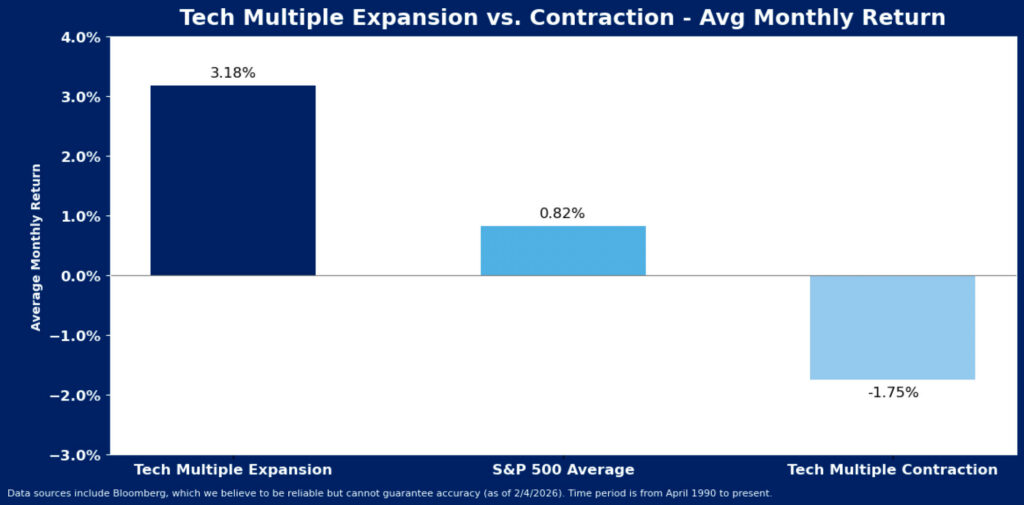
Considering the degree to which tech stocks have corrected over the past three months, the broad market is holding up reasonably well. Nonetheless, market returns can be expected to be muted when the tech sector valuations are not expanding. On average, when tech stocks de-rate, the broad market has struggled with lower returns. Since April 1990, when tech valuations fell, the average monthly S&P 500 return was -1.8%. In contrast, when tech stocks’ multiples rose, stocks post stronger monthly returns that averaged 3.2%. Over the last three months, even though tech stocks have dropped more than 10% and valuations have dropped about 7X, the index has posted below average, but nonetheless slightly positive average monthly returns. Rotation to the other groups in anticipation of strengthening earnings trends ex-tech has helped shelter the index from tech’s struggles. Without tech sector enthusiasm, these groups will need to continue to show strong recovery prospects to keep equities afloat.
Disclosure: HB Wealth is an SECregistered investment adviser. The information reflects the author’s views, opinions, and analyses as the publication date. The information is provided for informational purposes only and does not constitute an offer to sell or a solicitation of an offer to buy any investment product. This information contains forward-looking statements, predictions, and forecasts (“forward-looking statements”) concerning the belief and opinions in respect to the future. Forward-looking statements involve risks and uncertainties, and undue reliance should not be placed on them. There can be no assurance that forward-looking statements will prove to be accurate, and actual results and future events could differ materially from those anticipated in such statements. The information does not represent legal, tax, accounting, or investment advice; recipients should consult their respective advisors regarding such matters. Certain information herein is based on third-party sources believed to be reliable, but which have not been independently verified. Past performance is not a guarantee or indicator of future results; inherent in any investment is the risk of loss.
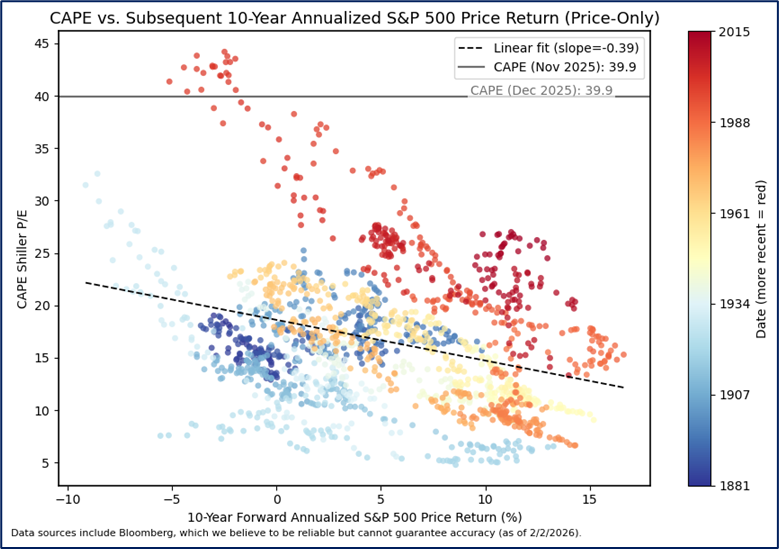
U.S. large cap stocks ended 2025 in rare valuations territory, with the cyclically adjusted PE ratio (CAPE) of 39.9 in the 99th percentile of all observations since 1881. US stock valuations by this measure are near 150-year highs, well north of the long-term average of 17.7, and even substantially higher than the recent 10-year average CAPE of 31.5. According to mean reversion theory, very poor market returns are likely to emerge with valuations this high. But decades of evidence show that these theories are highly flawed and very unreliable for shorter term return expectations. Our valuation model is based on current economic conditions rather than long term trends. It also suggests we should lower our expectations for returns in the short run. It does not, however, support the dire forecasts implied by mean-reversion assumptions embedded in CAPE analysis.
Cyclically adjusted valuation, as represented by the CAPE ratio, is designed to smooth out the effect of business cycles by averaging and inflation-adjusting the “E” in the P/E ratio over 10 years. That ratio is then meant to enable long-term return assumptions for stocks – higher CAPE is affiliated with lower long-term returns, and vice versa. While this method shows some efficacy in predicting returns over the long term, the relationship has shifted over time, and the recent track record is dubious at best.
Ten years ago, at the start of 2016, the CAPE ratio stood at 24.2. At the time this was in the 89th quartile of history, and implied 2.1% average annual returns were likely. Stocks posted 14% average annual returns over the last decade. Likewise, five years ago, the CAPE ratio was in the 98th percentile, implying -0.5% annualized returns were looming. Over the last five years, and including a very large correction in 2022, the S&P 500 has posted average annual gains of 14.3% per year for the last five years.
No valuation model is perfect, and multiples should be used as just one tool in the toolkit for evaluating potential market returns. One of the biggest flaws in the model may simply be the assumption of mean reversion, for valuations have shifted meaningfully over time. Thus, time period selection for defining a mean can make a rather large difference in the model’s implied forward return assumption. The current 10-year trailing mean CAPE is 31.5 while the 20-year mean is 27.3, and the 50-year mean is 22.6. Which is the correct time period for assuming mean reversion? Should “expensive” 100 years ago also be considered “expensive” today? CAPE assumes so, but the market appears to see it differently.
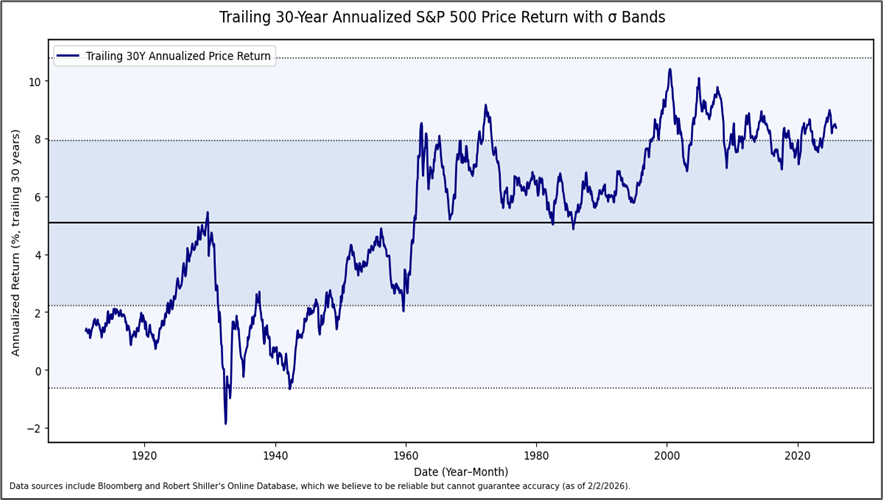
A CAPE of 25-30X in the 1920s and 1930s resulted in negative 10-year forward returns, but that same CAPE range in the 1980s and 1990s led to positive annualized returns over the subsequent 10 years. Long-term average equity market returns have been persistently higher for the last 50 years than they were in the 50 prior years, and recent years offered stronger average returns than in preceding decades despite elevated valuations. Long term market returns thus appear at best to have a loose relationship with valuations.
For many reasons, comparing today’s market multiples to past periods is fraught with peril. One of those reasons is the supply and demand landscape for US stocks, which is certainly constantly evolving with issuance, access and appeal. Over time, and especially over the last few decades, stocks valuations have trended higher as relatively scarce supply has been met with persistent and growing demand for public equity investment. If too much capital continues to chase too few equities, comparisons to the long-term past may prove faulty and CAPE may remain a poor predictor of forward market returns.
An alternative approach to using mean-reversion valuation assumptions may be to assess valuations based on timelier market cues and earnings conditions. While this model has a shorter-term focus than the CAPE model, and it is also imperfect given that the market is not precisely reflective of any subset of macroeconomic indicators, it nonetheless shows a strong quantitative fit between current market variables and valuations. We can observe what the variables imply for future returns based on what they meant for stocks in the recent past.
Based on current consensus expectations for the 2-year and 10-year Treasury yields, as well as forecasts for earnings growth to rise about 14% per year for the next two years, our regression model for US large cap stocks suggests the S&P 500 should trade closer to 19X earnings versus its current P/E ratio of about 22x.
Notably, current market cues do not confirm a reversion to long term mean valuations is imminent, but they do imply a lower multiple is likely, and this may slow down the recent torrid pace of equity market returns. In periods when the market P/E was above our model estimate over the last 25-years (as it is now), stocks averaged forward 12-month returns of 3.1%, and a median 5%. It also may help us identify the source of returns. As multiples reach levels above that supported by the indicators, earnings are more likely to be the primary return driver for equities. Our model suggested the composition of returns was likely to shift at the end of 2024, when multiples first pushed above indicated fair value. While returns exceeded expectations in 2025, the source of return clearly shifted to earnings from valuation expansion.
In sum, while the current economic environment suggests multiples may be more likely to compress to align with the rates landscape, it does not suggest a long-term period of negative returns is necessarily imminent. Instead, there is some support for valuations to remain higher than long term averages, just perhaps not as high as they currently are. Earnings growth could continue to offset downside that emerges with valuation pressure, effectively slowing down the pace of the bull charge in stocks, but not necessarily tipping the bull over entirely.
Disclosure: HB Wealth is an SEC‑registered investment adviser. The information reflects the author’s views, opinions, and analyses as the publication date. The information is provided for informational purposes only and does not constitute an offer to sell or a solicitation of an offer to buy any investment product. This information contains forward-looking statements, predictions, and forecasts (“forward-looking statements”) concerning the belief and opinions in respect to the future. Forward-looking statements involve risks and uncertainties, and undue reliance should not be placed on them. There can be no assurance that forward-looking statements will prove to be accurate, and actual results and future events could differ materially from those anticipated in such statements. The information does not represent legal, tax, accounting, or investment advice; recipients should consult their respective advisors regarding such matters. Certain information herein is based on third-party sources believed to be reliable, but which have not been independently verified. Past performance is not a guarantee or indicator of future results; inherent in any investment is the risk of loss.
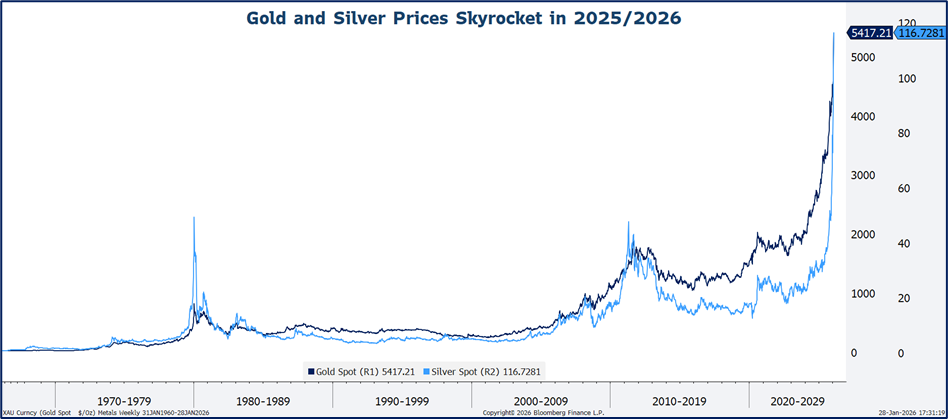
Metals prices are breaking records so far in 2026, hitting new all-time price highs and recording rates of price change last touched in 1979. Back then, prices rose until higher interest rates and a painful recession emerged. This time, gold might continue to run until geopolitical stability or an effort to stabilize the dollar surfaces. Silver’s surge may get under wraps only when energy and electronic production slows down.
Gold is traditionally a safe-haven asset and store of value, thus it gains support when the dollar weakens and when geopolitical uncertainty rises. Currently gold is serving both as a debasement hedge and in its more traditional role as competitor to U.S. Treasuries and money market funds, where yields have been contained with the Fed easing policy. Silver’s resurgence, in contrast, is more about industrial demand. The metal is an essential production component in solar energy, electronics and grid infrastructure.
Production cannot keep pace with growing demand in either market, thus, prices are accelerating. Metals mining is a slow, capital-intensive industry with growing constraints. This means that as prices surge, new supply cannot be brought online easily. Global gold mine output has increased only incrementally in recent years. Energy costs are rising, and new discoveries are rare. The silver market is even more constrained, with most global supply a by-product of base metals like copper, lead, and zinc.
The 52-week rate of change in both metals is in rare territory – gold has nearly doubled in the last year and silver jumped more than 3X, rates of change that have only occurred once in recent history – in 1979. Back then, geopolitical risks were also elevated and inflation concerns predominant. It took a Fed hike to break demand and slow the metals down. With supply structurally constrained, it will again likely take a break in demand to slow growth in prices. This could come from an increase in rates, geopolitical stability, an effort to stabilize the dollar, or in the case of silver, a slowdown in industrial production.
Disclosure: HB Wealth is an SEC‑registered investment adviser. The information reflects the author’s views, opinions, and analyses as the publication date. The information is provided for informational purposes only and does not constitute an offer to sell or a solicitation of an offer to buy any investment product. This information contains forward-looking statements, predictions, and forecasts (“forward-looking statements”) concerning the belief and opinions in respect to the future. Forward-looking statements involve risks and uncertainties, and undue reliance should not be placed on them. There can be no assurance that forward-looking statements will prove to be accurate, and actual results and future events could differ materially from those anticipated in such statements. The information does not represent legal, tax, accounting, or investment advice; recipients should consult their respective advisors regarding such matters. Certain information herein is based on third-party sources believed to be reliable, but which have not been independently verified. Past performance is not a guarantee or indicator of future results; inherent in any investment is the risk of loss.
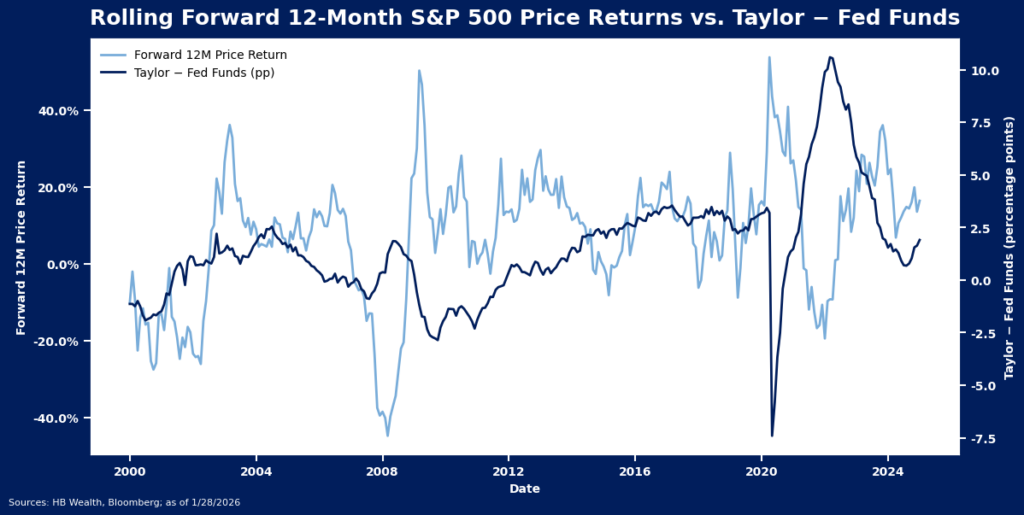
The FOMC paused rate cuts in January, with stabilizing labor markets and inflation pressures offering little reason to ease more at the current time. They didn’t need to ease more to stay easy anyway – after three consecutive declines in the benchmark rate in late 2025 the Taylor rule suggests policy is in accommodative territory. The spread between the Taylor rule and Fed funds is north of 2% currently, above its 25-year average of 1.5.
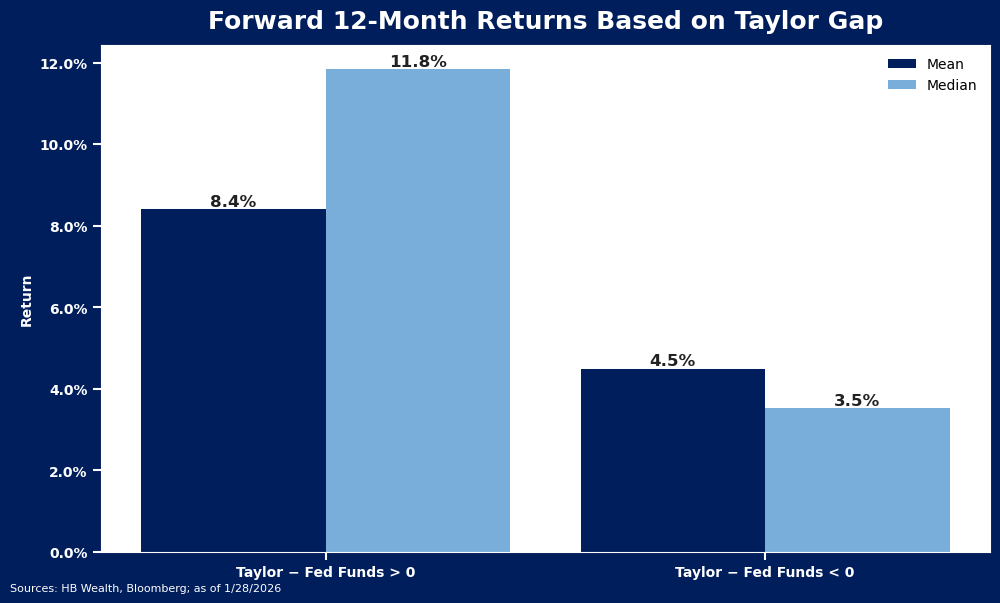
Stocks may not like the move much – we estimated earlier this year that equities were holding out hope for up to 4 cuts to emerge this year, and that seems increasingly unlikely. However, the current level of accommodation still sets a positive backdrop for equities. The market has averaged a 8.4% forward 12-month return when policy was accommodative (Fed funds rate below the rate implied by the Taylor rule), and a 4.5% forward 12-month return when policy was restrictive (Fed funds above).
The Fed did leave some hints in the post-meeting statement regarding what they may need to see to resume easing in future months. Policymakers said the “unemployment rate has shown some signs of stabilization”. This contrasts language in the last three statements that pointed to downside risks to employment as a concern and suggests jobs figures may have the biggest sway in future policy decisions.
With the Fed meeting now in the past, the market will quickly turn its attention back to earnings as a primary driver of prices in the near term. Mega cap tech stocks face lofty expectations for near 30% growth in 2026 and will need to justify those expectations to keep stocks powering higher.
Disclosure: HB Wealth is an SEC‑registered investment adviser. The information reflects the author’s views, opinions, and analyses as the publication date. The information is provided for informational purposes only and does not constitute an offer to sell or a solicitation of an offer to buy any investment product. This information contains forward-looking statements, predictions, and forecasts (“forward-looking statements”) concerning the belief and opinions in respect to the future. Forward-looking statements involve risks and uncertainties, and undue reliance should not be placed on them. There can be no assurance that forward-looking statements will prove to be accurate, and actual results and future events could differ materially from those anticipated in such statements. The information does not represent legal, tax, accounting, or investment advice; recipients should consult their respective advisors regarding such matters. Certain information herein is based on third-party sources believed to be reliable, but which have not been independently verified. Past performance is not a guarantee or indicator of future results; inherent in any investment is the risk of loss.
International equities meaningfully outperformed US stocks last year, but the value of holding non-domestic stocks extends well beyond returns. Critically, correlations among markets have been falling and dispersion of returns between regions has been rising as well, elevating the diversification benefit of international stocks. As geopolitical and trade risks continue to evolve and widen the gulf between global economies, non-domestic equities may remain a source of portfolio ballast.
Equities are Less Correlated as the World Economy Decouples
The case for global equity ownership extends well beyond relative returns. As world trade volumes have declined and the world decoupled, global shares have offered significant and potentially still underappreciated diversification benefits to equity portfolios.
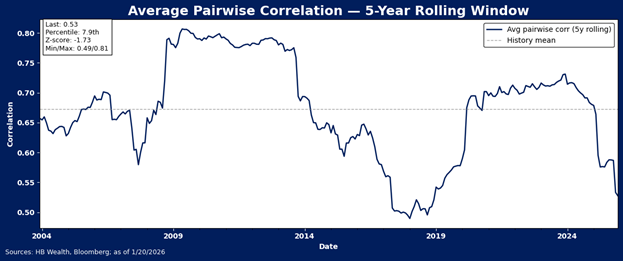
Relative to five-year norms, correlations among major country markets largely dropped over the last year, extending a trend of falling correlations in global equity markets that began again in 2024. Five‑year rolling average correlations across global equity markets have fallen to their lowest level since 2019. Our analysis of rolling five-year correlations across shows the current reading is sitting roughly 1.73 standard deviations below the long‑term average observed since 2004.
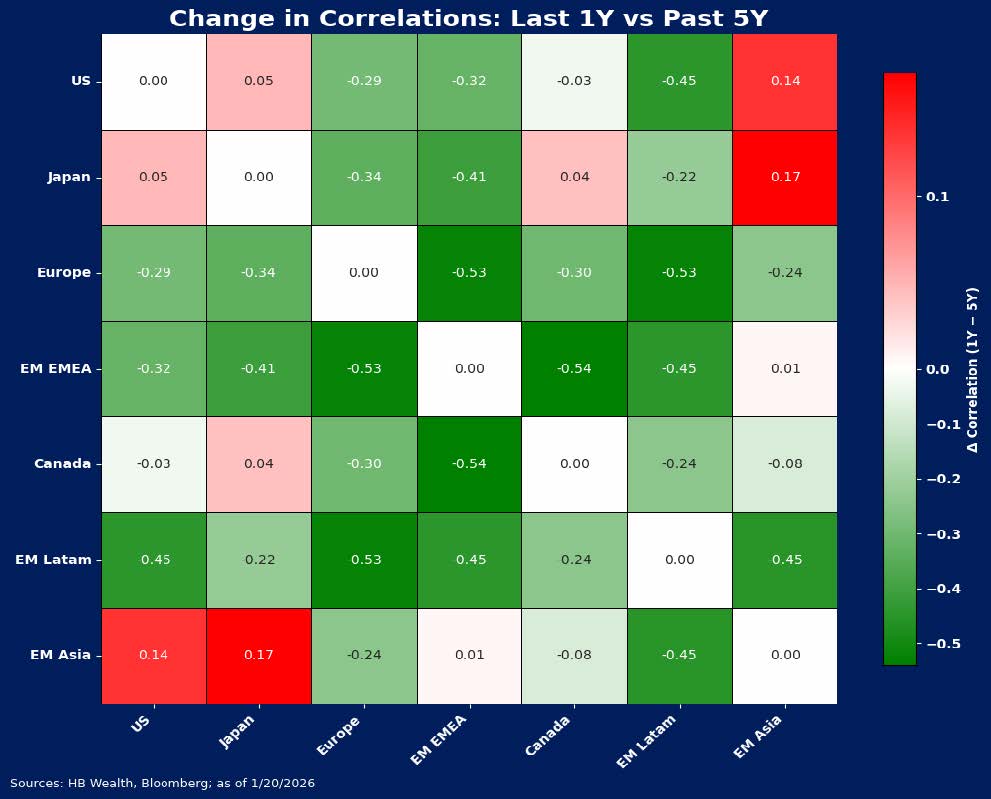
Over the last year, Europe, emerging markets, and Latin American equities all became less correlated to the U.S. equity market, and emerging markets at large decoupled from developed markets. Europe and Latin America showed particularly broad declines in correlation with other global equity markets. Among major markets, the only significant increases in cross-market correlations emerged between the US, Japan and EM Asia, as technology sector concentration tied these markets more closely together.
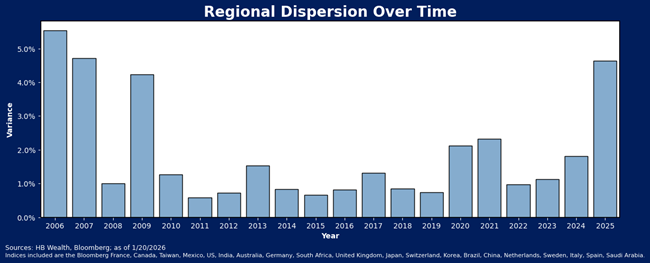
Notably, declining correlations are not the only wind at the back of international equities. Material diversification benefits can also be achieved as dispersion (or variance) rises, and dispersion of returns across the top global markets also rose to its highest level in nearly 20 years in 2025. On average, return dispersion was extremely low in the decade after the financial crisis, but has been generally higher in the years since the pandemic, as regional growth divergences and thematic influences have taken on a stronger role in driving returns amid geopolitical strains. Notably, dispersion hit a level last year that is closer to the pre-crisis norms, when US stocks were less consistent leaders of world equity returns.
Disclosure: The information reflects the author’s views, opinions, and analyses as the publication date. The information is provided for informational purposes only and does not constitute an offer to sell or a solicitation of an offer to buy any investment product. This information contains forward-looking statements, predictions, and forecasts (“forward-looking statements”) concerning the belief and opinions in respect to the future. Forward-looking statements involve risks and uncertainties, and undue reliance should not be placed on them. There can be no assurance that forward-looking statements will prove to be accurate, and actual results and future events could differ materially from those anticipated in such statements. The information does not represent legal, tax, accounting, or investment advice; recipients should consult their respective advisors regarding such matters. Certain information herein is based on third-party sources believed to be reliable, but which have not been independently verified. Past performance is not a guarantee or indicator of future results; inherent in any investment is the risk of loss.
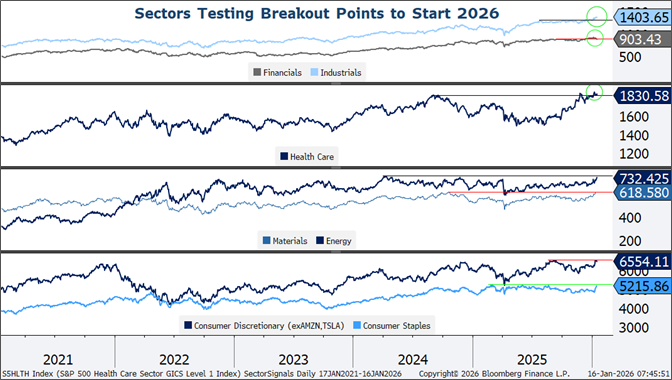
Domestic growth themes based on policy support and regulatory reprieve have largely driven equity market rotation out of tech and toward other sectors in the US equity market in recent months. Renewed geopolitical turmoil and some disappointment on the domestic policy front now threatens to upend the party in 2026. All sectors but tech and financials are up to start the year, but only industrials – the sector that threads the needle of both domestic recovery and geopolitical risk – has decisively broken out beyond former resistance levels. As policy headwinds continue to shift, we expect company commentary around how it may impact earnings trends in the next few weeks may help discern winners from losers in the U.S. equity market.
Commodities and Consumer May Battle
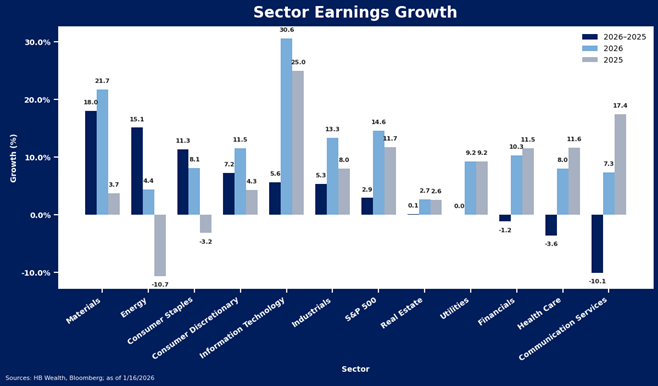
The strongest earnings turnaround in the S&P 500 is expected to come from a very unusual combination of both consumer sectors and commodity sectors in the year ahead. Consumer staples and consumer discretionary sectors are anticipated to both growth in 2026 after recording earnings declines in 2025, thanks to a presumed consumer recovery as well as margin gains with lower inflation pressures. Fed rate cuts and easing financial conditions are supposed to help get debt-financed consumer spending growing again while tax refunds help spur a recovery in disposable income growth, which has recently stagnated with wages and jobs. This should help topline, while reduced trade risks and moderating inflation contribute to margin growth for this group.
Meanwhile, energy and materials are expected to record an even stronger earnings recovery. Raw industrials, oil and precious metals prices are rising much faster than equity prices so far this year, as elevated geopolitical risks are helping spur a surprising break higher in commodities prices, adding to fundamental upside for the groups.
While energy and materials clearly benefit from higher prices, consumer spending and consumer sector margins are susceptible to downside shock as oil prices rise. Thus, while not impossible, the notion that both consumer sectors and commodity sectors will simultaneously lead recovery seems somewhat improbable, and dependent on how much geopolitical risk evolves in the weeks ahead. Outperformance of domestic cyclicals will only likely continue if commodity price gains are contained, and vice versa – commodity sectors will likely only lead if price appreciation remains.
Regulatory Risks May Make or Break Health Care and Financials
The most policy-sensitive segments – financials and health care – are on the other end of the earnings growth momentum scale, both anticipated to post growth in earnings, but at a slower pace than was recorded in 2026. Despite this inferior relative earnings position, both sectors have toyed with breakouts so far this year, perhaps due to anticipated policy and regulatory reforms. This will leave both sectors somewhat vulnerable to those very regulatory and policy headlines to keep their trends moving higher. Financials have been recently plagued by White House remarks about housing and credit card rates, and health care faces significant challenges stemming from expiration of Affordable Care Act financial assistance.
Industrials In-Between
The industrials sector does not have the strongest anticipated earnings momentum in the index, but it may benefit most among sectors from the combination of policy support) as well as rising geopolitical risk. Tax reform promotes capital spending to boost industrials’ revenue while lower short-term rates ease the sectors’ heavy debt burden. Meanwhile, geopolitical turmoil and rising global defense budgets directly support the defense industry. Higher commodity costs may elevate input prices for some but benefit topline growth for more.
In summary, the year has started off with all sectors but tech winning, but the themes that have driven gains so far are likely to be tested as the year progresses, leading to greater dispersion at the sector, industry and stock level in the S&P 500. If tech comfortably settles into the backseat, new drivers will emerge, but not likely all at once.
Disclosure: The information reflects the author’s views, opinions, and analyses as the publication date. The information is provided for informational purposes only and does not constitute an offer to sell or a solicitation of an offer to buy any investment product. This information contains forward-looking statements, predictions, and forecasts (“forward-looking statements”) concerning the belief and opinions in respect to the future. Forward-looking statements involve risks and uncertainties, and undue reliance should not be placed on them. There can be no assurance that forward-looking statements will prove to be accurate, and actual results and future events could differ materially from those anticipated in such statements. The information does not represent legal, tax, accounting, or investment advice; recipients should consult their respective advisors regarding such matters. Certain information herein is based on third-party sources believed to be reliable, but which have not been independently verified. Past performance is not a guarantee or indicator of future results; inherent in any investment is the risk of loss.
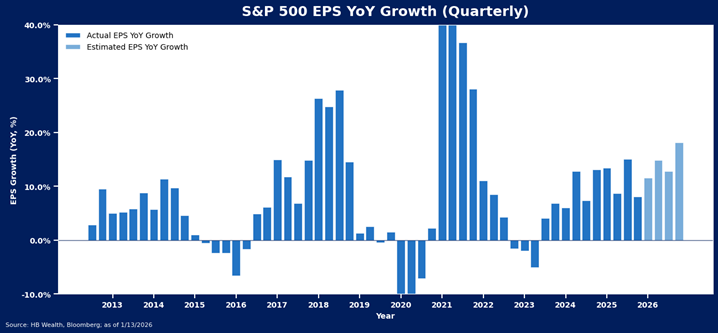
Analyst expectations for about 8% growth in S&P 500 EPS in the fourth quarter earnings season appear likely to be easily beaten, but the forecast for the index to accelerate the pace and end 2026 with nearly 20% EPS growth remains up for debate. Likewise, our macro model suggests the market is priced for even stronger growth than the analyst community anticipates. Thus, the onus will be on companies to set an optimistic tone in the reporting season now underway. We will be watching three major sector themes – tech’s hat trick, financials’ valuation party, and consumer sectors’ revival – to confirm or deny lofty expectations in the weeks ahead.
Hat Trick for the Tech Sector?
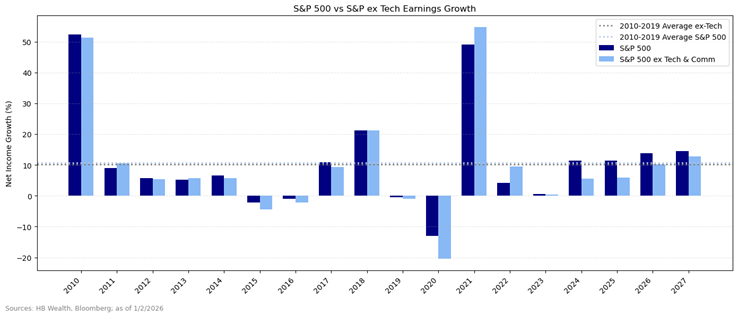
The tech sector has tripled the pace of earnings growth for the rest of the S&P 500 for the last two years and is expected to do so again, with consensus forecasting 30% tech sector net income growth, 3X the 10% growth for the rest of the S&P 500 in 2026. These lofty expectations are notably supported by a hefty margin gain – tech sector operating margins are forecast to rise to a record high 37.6% while net income margins are forecast to surpass 30% for the first time ever. With the bond market getting increasingly nervous about the sector’s ability to sustain the pace of capital spending with debt funding (see Oracle CDS spreads at levels last touched in 2008!), tech’s expected hat trick may be tough to pull off in the year ahead. Companies will need to confirm that AI is getting implemented at a rapid pace, and they won’t need to stretch much to fund its ongoing deployment.
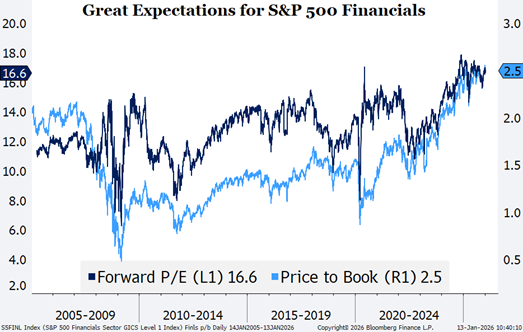
Financials Party Like its 2007?
The consensus expectation for financials appears relatively sanguine, at anticipated 9% growth in 2026 to mimic 2025’s result, but what is priced in the market is more optimistic. Valuations, both on a price to earnings and price to book basis, are at twenty-year highs, and well north of levels touched in the sector’s pre-financial crisis heyday. This suggests even though analysts may be somewhat cautious, the market is expecting something of a boom for the sector. As the yield curve is still rather flat, the onus may be on regulatory reprieve, trading activity and investment banking transactions to justify the sector’s valuation burden this year. Recent comments from the U.S. President on regulation of housing activity and credit card rates could suggest expectations for a broad regulatory reprieve may be particularly questionable.
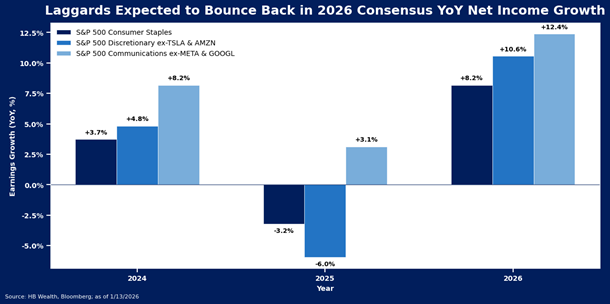
Consumer Revival?
There is a notable disconnect between consumer sentiment – still near all-time lows – and expectations for a consumer spending revival to emerge in S&P 500 sectors in 2026. Three of 2025’s biggest laggards – consumer staples, consumer discretionary and communications – are all expected to stage a remarkable turnaround on the foundation of lower interest rates and the deployment of tax refunds in 2026. Consumer staples and consumer discretionary (excluding Amazon and Tesla) posted net income declines in 2025 and are expected to post 8.2% and 10.5% growth in 2026, while the communications sector (excluding Alphabet and Google) is expected to post 12.4% growth, tripling 2025’s 3.1% pace. Consumers will need to shake off their sour mood and spend at a faster pace to support the consensus expectation for growth this year.
Disclosure: The information reflects the author’s views, opinions, and analyses as the publication date. The information is provided for informational purposes only and does not constitute an offer to sell or a solicitation of an offer to buy any investment product. This information contains forward-looking statements, predictions, and forecasts (“forward-looking statements”) concerning the belief and opinions in respect to the future. Forward-looking statements involve risks and uncertainties, and undue reliance should not be placed on them. There can be no assurance that forward-looking statements will prove to be accurate, and actual results and future events could differ materially from those anticipated in such statements. The information does not represent legal, tax, accounting, or investment advice; recipients should consult their respective advisors regarding such matters. Certain information herein is based on third-party sources believed to be reliable, but which have not been independently verified. Past performance is not a guarantee or indicator of future results; inherent in any investment is the risk of loss.
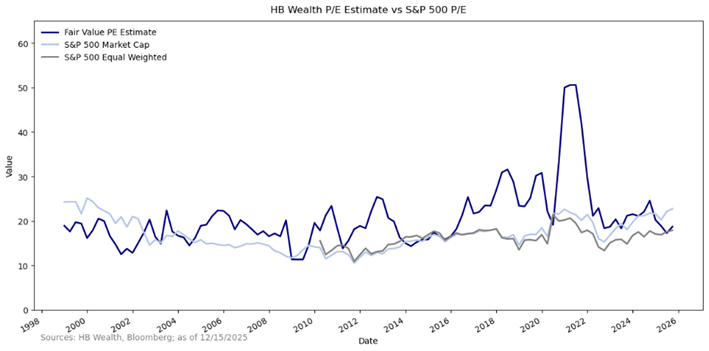
Our macro model for S&P 500 valuations shows multiples have jumped too far ahead of macroeconomic support and this may slow the pace of index price growth in the near term. This model suggested markets were largely undervaluing low interest rates for most of the last two decades, supporting the case for multiple expansion and robust price growth. Now it suggests that the market is overvalued. The last time our valuation model fell this far short of the market was during the tech bubble, but the model also shows stocks’ valuation excess is quite small by comparison to that time.
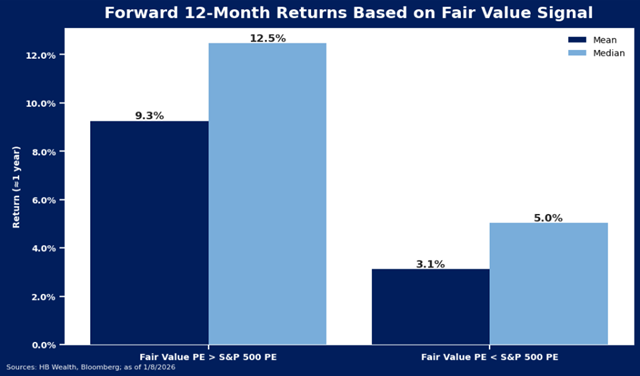
Valuations are notoriously poor timing tools and thus should be just one component of a decision process. Nonetheless, our model for valuations suggests a slower growth landscape for stocks may be set to emerge in the year ahead. Based on current consensus expectations for the 2-year and 10-year Treasury yields, as well as forecasts for earnings growth to rise about 14% per year for the next two years, our regression model for US large cap stocks suggests the S&P 500 should trade closer to 19X earnings versus its current P/E ratio of about 22x.
Since 1999, in periods when the market P/E was below our model estimate, forward 12-month returns for the market averaged 9.3%, and the median return was 12.5%. Over 40% of the market return in these periods came from valuation expansion. Now that the market has gotten ahead of the model estimate, it implies lower expected returns for stocks. Or, at least, returns that are more dependent on earnings growth than on valuation expansion. Over the last 26 years, when the market PE was above our modeled PE, the market return averaged 3.1% and valuation expansion accounted for slightly less (35%) of the return during those periods.
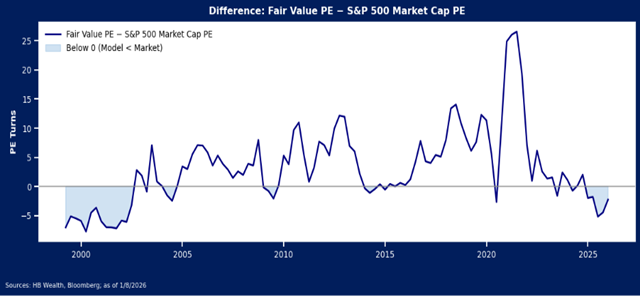
While 2025’s excess is still modest by comparison, the only other extended period when the combination of bond yields and earnings growth undershot market multiples was during and just after the turn of the century tech bubble. At that time, the model undershot market multiples for several consecutive years, and by a much larger margin. Our model suggested the market was overvalued from March 1999 to June 2002, or 39 months, and by up to 7.7 turns. At max this time, our model suggested the market was 5.2 turns overvalued, and the model has hinted at excess valuation for the last 15 months.
Prior to this past year, the market only became overvalued by comparison to its macro supports for brief stretches, and excess valuation was minimal. This mandated an optimistic outlook for valuation expansion to contribute to price appreciation. The model now suggests valuations are a risk to stocks. Thus, multiples may be more likely to compress to align with the rates landscape, effectively slowing down the pace of the bull charge in stocks in the year ahead.
Disclosure: The information reflects the author’s views, opinions, and analyses as the publication date. The information is provided for informational purposes only and does not constitute an offer to sell or a solicitation of an offer to buy any investment product. This information contains forward-looking statements, predictions, and forecasts (“forward-looking statements”) concerning the belief and opinions in respect to the future. Forward-looking statements involve risks and uncertainties, and undue reliance should not be placed on them. There can be no assurance that forward-looking statements will prove to be accurate, and actual results and future events could differ materially from those anticipated in such statements. The information does not represent legal, tax, accounting, or investment advice; recipients should consult their respective advisors regarding such matters. Certain information herein is based on third-party sources believed to be reliable, but which have not been independently verified. Past performance is not a guarantee or indicator of future results; inherent in any investment is the risk of loss.
January events could set the tone for stocks in the year ahead, as elevated market multiples imply both the Q4 earnings season and FOMC Meeting are likely to be critical moments that set the stage for equity market direction. Given valuations for the market are well north of levels justified by current macro conditions, either earnings need to soar much more than the consensus expects, or the Fed needs to firmly state a path to easy policy to keep the bull market intact to start the year.
Even though stocks generally perform well when the Fed is easing, the current bond market forecast suggests it may still be difficult for the Fed to be able to satisfy stocks’ hopes. All else equal, the current market multiple north of 22X suggests stocks may already be priced for at least 100 basis points of additional cuts from the Fed. If the bond market is right to suggest about half of that is likely in 2026, this supports a market multiple for US stocks that is less than 20 times earnings, according to our model.
If the Fed cannot provide stocks as much monetary support as is expected, the onus will be on companies to stage an extraordinary earnings comeback to keep the rally intact. Over the last two years, macroeconomic conditions have supported just under 6% average growth in ex-tech earnings, with tech stocks kicking in growth of about 25%, resulting in average net income growth for the index of 11% in both 2024 and 2025. Assuming economic conditions improve in line with economic consensus, a moderate acceleration in ex-tech growth could emerge in 2026. Our model says 8% growth in S&P 500 earnings is a reasonable expectation for the year, and the bottom-up consensus says 10%. However, this will not be enough to justify current valuations with only modest Fed support. To justify current multiples with just 2 rate cuts, US large cap stocks may need to put up 30% earnings growth over the next year. Thus, if the Fed is unable to comply with lofty expectations for easing, a lot of optimistic corporate profits outlook commentary will be needed in the reporting season just ahead.
Disclosure: The information reflects the author’s views, opinions, and analyses as the publication date. The information is provided for informational purposes only and does not constitute an offer to sell or a solicitation of an offer to buy any investment product. This information contains forward-looking statements, predictions, and forecasts (“forward-looking statements”) concerning the belief and opinions in respect to the future. Forward-looking statements involve risks and uncertainties, and undue reliance should not be placed on them. There can be no assurance that forward-looking statements will prove to be accurate, and actual results and future events could differ materially from those anticipated in such statements. The information does not represent legal, tax, accounting, or investment advice; recipients should consult their respective advisors regarding such matters. Certain information herein is based on third-party sources believed to be reliable, but which have not been independently verified. Past performance is not a guarantee or indicator of future results; inherent in any investment is the risk of loss.
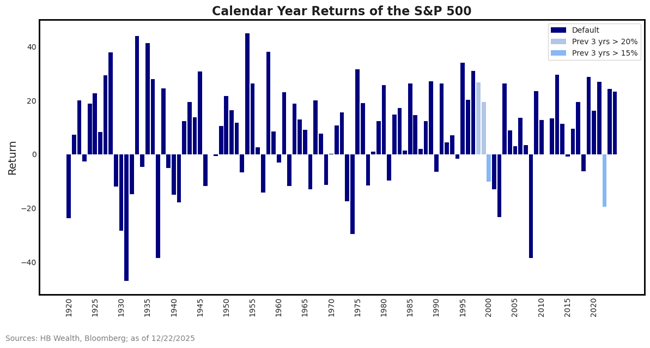
The S&P 500 is on pace for a third consecutive year of more than 15% price growth, and if a Santa Claus rally takes shape in the final trading days of the year, it could hit rare air with a third straight year of 20% growth. There is little historical precedent for extreme moves such as that which has just occurred in equity markets. Yet, if Wall Street analysts are correct, stocks may post a fourth year of double-digit gains in 2026, pushing the bull market to join only the 1990s tech bubble in duration and degree.
Stocks have recorded three straight years of 15% just twice since the early 1920s – in the late 1990s and surrounding the pandemic – and three straight years of 20% growth occurred only during the tech bubble. After the 15%+ occurrences, the average gain in the 4th year was 4.2%, with stocks up 19.5% that following year in the 90s but down 19.4% in 2022.
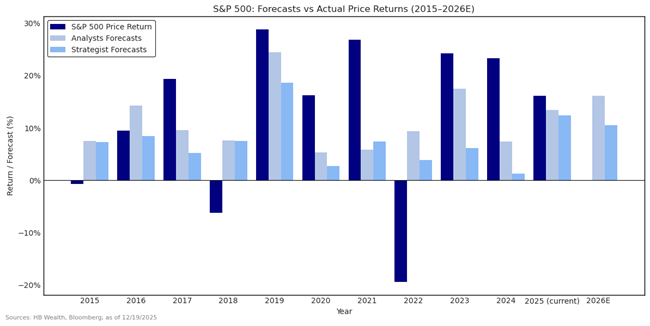
Wall Street analysts have a recent history of underestimating growth in stocks in years when stocks rise but got closer to predicting the return of the stock market last year than any year in the last ten. This time last year, bottom-up analysts forecasted price growth of 13% for the S&P 500 and the average top-down strategist estimate was for 12% growth. The combined group of forecasters was the most optimistic since 2018, when the group average forecast was for a 22% gain in stocks the following year. (That estimate also proved to be a bit low.)
On average over the last 10 years, analysts have underestimated stocks’ price growth by 1% per year while strategists underestimated by 5% per year. However, that includes major misses in the years when stocks fell. Indeed, overestimations only occurred for the years when stock prices fell. Forecasters have not predicted stocks would fall any year in the last ten. In the years that stock prices rose, analysts thus underestimated price growth by 10 percentage points and strategists underestimated the index gain by 15 percentage points, on average.
Analysts are now forecasting 16% price growth for the index while strategists are targeting about 10%, resulting in an average price growth forecast about the same as a year ago. If they are right, the current bull market will surpass the duration and degree of the pandemic bull. Only the 1990s tech bubble will offer historical comparison.
Disclosure: The information reflects the author’s views, opinions, and analyses as the publication date. The information is provided for informational purposes only and does not constitute an offer to sell or a solicitation of an offer to buy any investment product. This information contains forward-looking statements, predictions, and forecasts (“forward-looking statements”) concerning the belief and opinions in respect to the future. Forward-looking statements involve risks and uncertainties, and undue reliance should not be placed on them. There can be no assurance that forward-looking statements will prove to be accurate, and actual results and future events could differ materially from those anticipated in such statements. The information does not represent legal, tax, accounting, or investment advice; recipients should consult their respective advisors regarding such matters. Certain information herein is based on third-party sources believed to be reliable, but which have not been independently verified. Past performance is not a guarantee or indicator of future results; inherent in any investment is the risk of loss.
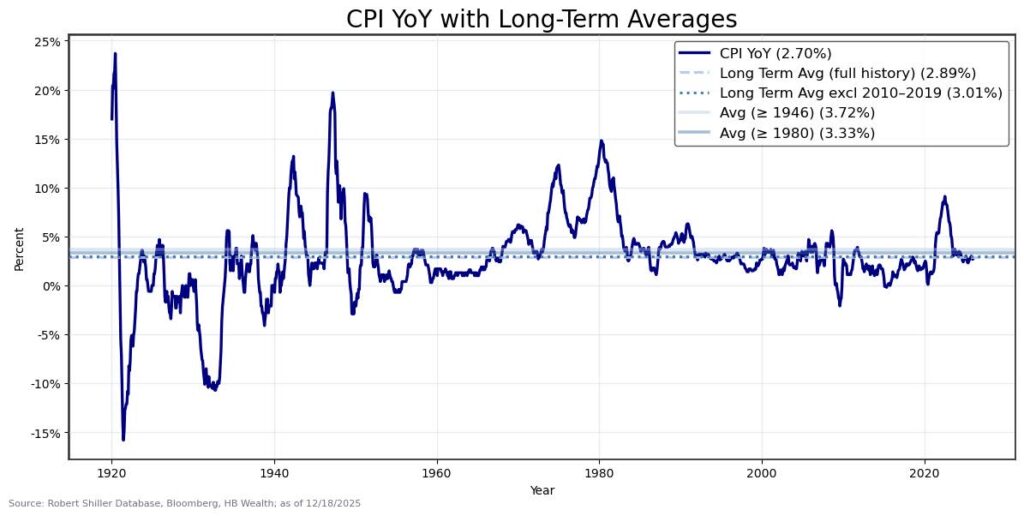
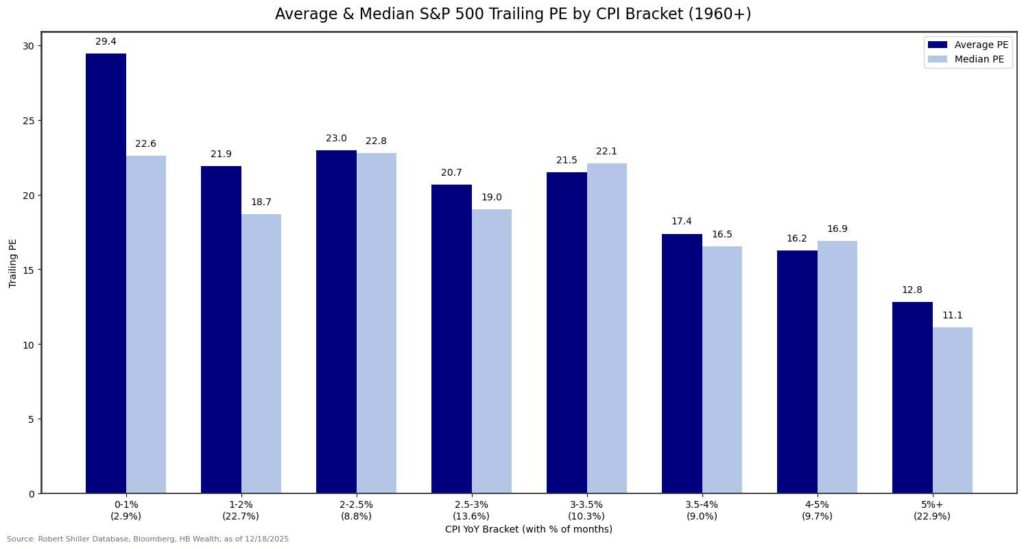
After rising for the bulk of the summer, consumer prices finally eased somewhat this fall, and the consumer price index (CPI) hit its slowest pace of growth since 2021 in November. It is too early to call an “all clear” on inflation risks, as autumn data may be somewhat distorted by the government shutdown and this year’s monetary, fiscal and trade policy shifts could still pressure prices higher in the year ahead. Lower inflation will likely need to persist to help support equity valuations. The current multiple at 27X is already well above the 19-20X that on average occurred with CPI in its current range. Yet, multiples were not historically negatively impacted until CPI rose above 3.5%.
Consumer price inflation (at 2.7% in November) is now back below its long-term average growth pace of 2.9%, and if it holds there, it could help justify Fed easing toward a terminal rate near 3%. Over the very long term (since 1920), year-over-year growth in the consumer price index (CPI) has averaged 2.9%. Excluding the deflationary scares of the Great Depression and the Great Financial Crisis, the average is 3.6%. And since 1982, the average has been 2.9%. So, no matter how we slice the data, 2.7% is slightly below long-term average inflation.
Stocks are already trading at multiples well north of what is justified by inflation. S&P 500 multiples averaged 20.7X in the current inflation range of 2.5-3% since 1960. The current multiple of 27X is above all experiences except the inflation range of 0-1%, when equity market multiples averaged 29.4X. The equal weighted S&P 500 index multiple, at 22X, is closer to the inflation regime norm implied by history but also is already higher than the level justified by inflation historically. However, historical patterns suggest that meaningful derating has typically occurred when inflation rises above roughly 3.5%. Stocks multiples historically ranged between 19X-23X when inflation was anywhere between 1-3.5%, but material drops in valuation were experienced with inflation above 3.5%.
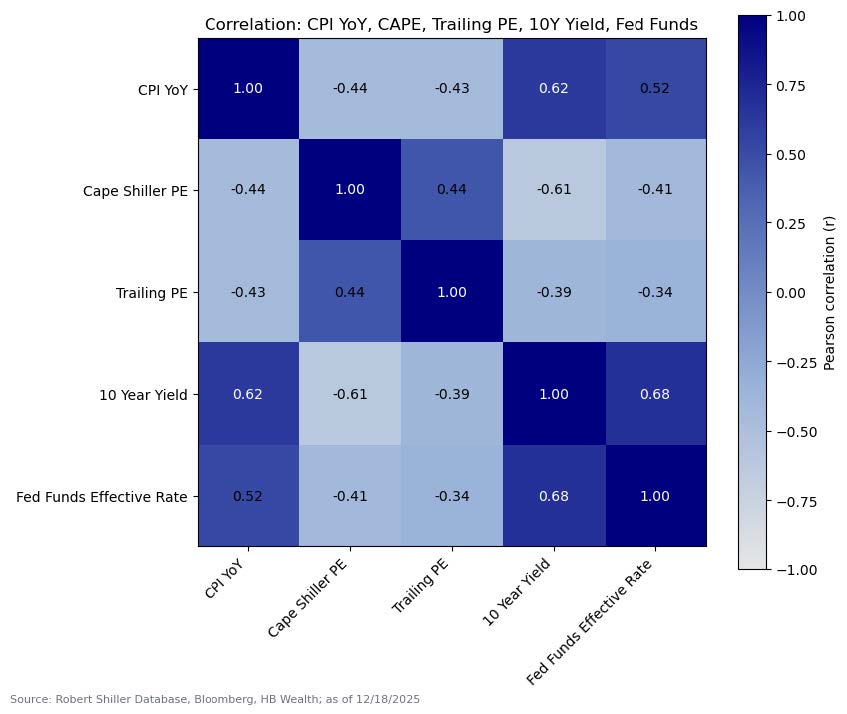
While the current level of inflation does not imply much by way of upside for stocks valuations, the direction of change as well as the level matters for equity markets, so we cannot simply rule out the potential for positive price impacts to emerge, particularly if inflation quiets enough to decrease interest rates. Consumer prices have relatively strong correlations with equity market valuations over time, and correlations between CPI and stocks’ PE, both on a cyclically adjusted and unadjusted basis, is negative. When inflation accelerates, it tends to suppress valuations, and vice versa. The correlation between CPI and interest rates is even stronger, so if lower price inflation keeps a rise in bond yields at bay and enables the Fed to decrease short-term interest rates, stocks could still benefit from some inflation reprieve.
HB Wealth is an SEC Registered Investment Adviser and the information provided is for informational purposes only and should not be construed as investment advice or a recommendation to buy or sell any security, cryptocurrency, or other financial instrument. Digital assets, including cryptocurrencies, are highly volatile and may not be suitable for all investors. Past performance is not indicative of future results. Investing involves risk, including the possible loss of principal. The views expressed are those of the author and do not necessarily reflect the opinions of HB Wealth. Comments for this post are not monitored. Please consult your financial advisor before making any investment decisions.
Stocks rallied on welcome news of another round of liquidity provision and brightening growth from the Federal Reserve last week, only to unwind the trade (and then some) in recent days. Our valuations Model suggests the equity market may continue to struggle to see a few more Fed cuts as reason to push market multiples to new highs, implying the market outlook will be more reliant on earnings trends in 2026. Meanwhile, a look beneath the hood to examine the drivers of valuation reveals that rotation could help ease valuation risks to the U.S. equity market.
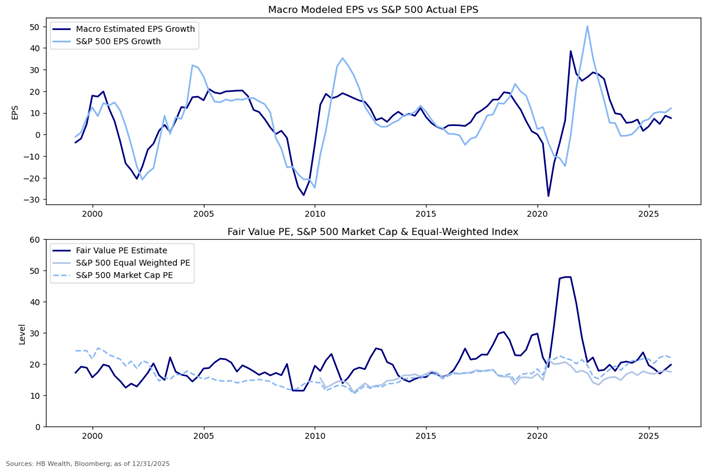
Rates alone aren’t likely to head low enough to support current equity valuations, and will need support from a robust earnings outlook to keep stocks’ multiples afloat in the year ahead. U.S. large cap equity P/E is hovering near levels last recorded in 2021, when short-term interest rates were near zero and 10-year Treasury yields were less than 2%. Based on current consensus expectations for the 2-year Treasury rate to hit 3.3% and the 10-year Treasury yield to be 4.1% in a year, as well as forecasts for earnings growth to rise about 14% per year for the next two years, our regression model for US large cap valuations suggests the S&P 500, trading at 22.5x earnings, is about 4 turns too rich.
Valuations are notoriously difficult to model with macro variables alone and are very poor timing mechanisms for stocks to boot, so multiples are just one piece of the puzzle of markets to consider. However, the recent divergence between the macro model and the market reality is worth exploring because this macro model struck an optimistic tone for equity markets for most of the last two decades. For most of the recent past, macro cues suggested equity multiples should be higher than observed. Indeed, prior to this past year, the only other extended periods in time in which the combination of bond yields and earnings growth undershot market multiples was during and just after the turn of the century tech bubble and in the mid-cycle correction of 2015-16.
Notably, as valuations for the market cap weighted index overshot our fair valuation model estimate, the equal weighted index has continued to trade at a discount to implied fair valuation, suggesting the valuation excess is concentrated in high-priced large market cap stocks. On an equal-weighted basis, stocks trade at 18 times earnings, still a touch below what the bond market and earnings trends together imply is fair valuation. This valuation gap may suggest the Magnificent-7 (Mag-7) has now emerged as a significant risk to stocks, but it also hints that there remain valuation discounts hidden beneath the heavy weight of this dominant group.
The evolution of the gap between market-cap weighted and equity weighted valuations is important to acknowledge, for it may offer hints as to what may trigger valuation normalization. The gap is largely explained by the Mag-7, and fundamental performance of this group in contrast to the rest of the index.
In recent years, Mag-7 stocks started recording both abnormally strong earnings and notably large earnings beats, particularly as the rest of the index experienced unusually weak earnings conditions. On average since 2023, the Mag-7 has recorded more than 30% earnings growth, and the Mag-7 stocks have managed to top earnings expectations each year since 2023. This Mag-7 growth phenomenon has occurred as the rest of the index has struggled to produce even average growth while continuing to miss consensus. On average, the ex-Mag-7 has recorded earnings growth of just 3% since 2023, and the last time ex-Mag 7 stocks beat forecasts was in 2021.
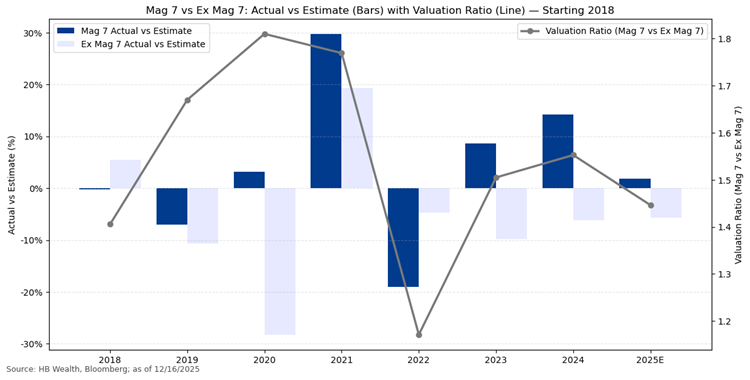
Given this valuation phenomenon, the outlook for S&P 500 valuations may depend less on a few more cuts from the Fed, and more on the degree to which earnings trends shift. To sustain elevated valuations and justify the gap between market cap weighted and equal weighted valuations, the Mag-7 group likely needs to keep topping forecasts and producing growth well above the rest of the index. In contrast, the valuation gap may close with Mag-7 misses and/or better growth emerging from the rest of the index. Currently, the consensus sees Mag-7 earnings growth of 18.1% in 2026. While this is slower than the pace in recent years, it is still 1.3x faster than the rest of the index, which is projected to grow earnings 13.5%. Meanwhile, the rest of the index may have an opportunity to shine, if they can recover stronger growth, and especially if they manage to beat expectations for the first time since 2021.
Disclosure: The information reflects the author’s views, opinions, and analyses as the publication date. The information is provided for informational purposes only and does not constitute an offer to sell or a solicitation of an offer to buy any investment product. This information contains forward-looking statements, predictions, and forecasts (“forward-looking statements”) concerning the belief and opinions in respect to the future. Forward-looking statements involve risks and uncertainties, and undue reliance should not be placed on them. There can be no assurance that forward-looking statements will prove to be accurate, and actual results and future events could differ materially from those anticipated in such statements. The information does not represent legal, tax, accounting, or investment advice; recipients should consult their respective advisors regarding such matters. Certain information herein is based on third-party sources believed to be reliable, but which have not been independently verified. Past performance is not a guarantee or indicator of future results; inherent in any investment is the risk of loss.
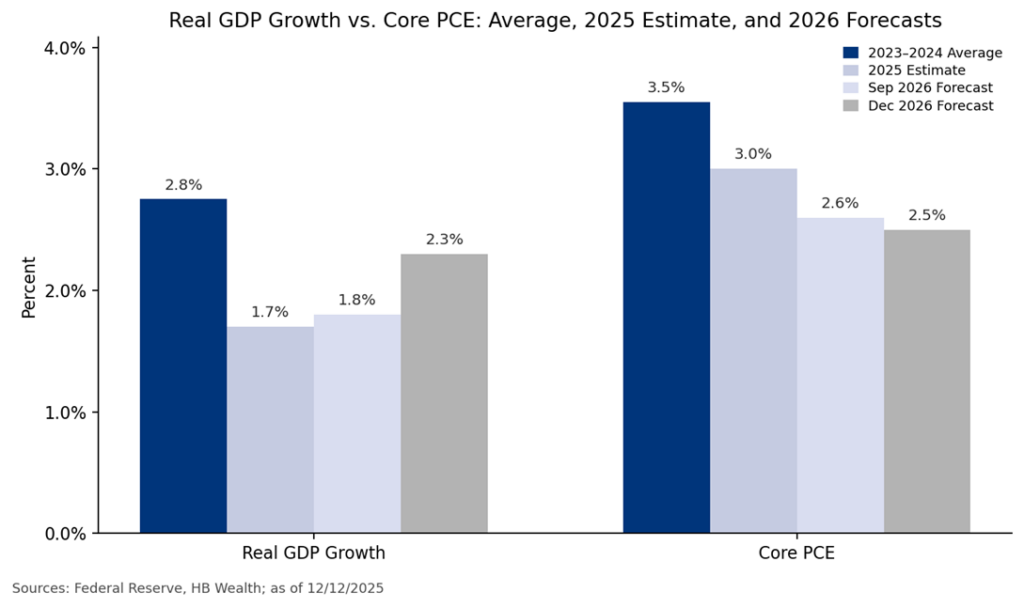
The Federal Reserve meeting this week offered more than just a liquidity cue for markets. It also contained hints that the time for AI to morph from tech profits-driver to broader economic force may be emerging. If growth accelerates while inflation eases, as the Fed now expects, S&P 500 profits may get an unexpected boost in 2026. The nature of that profits boost could result in easing concentration risk for the US equity market.
Though the Fed reduced rates at their meeting this week, the better news for stocks might be found in their forecast for growth and inflation. Growth is now expected to accelerate while inflation eases in the year ahead. The median estimate suggests a GDP gain of 2.3% next year, a full half point faster than the September forecast for 1.8%, and core inflation is expected to rise 2.5% in the year ahead, less than the September projection for 2.6%. This implies GDP growth recovery to near pre-2025 norms and the lowest inflation figure since 2020.
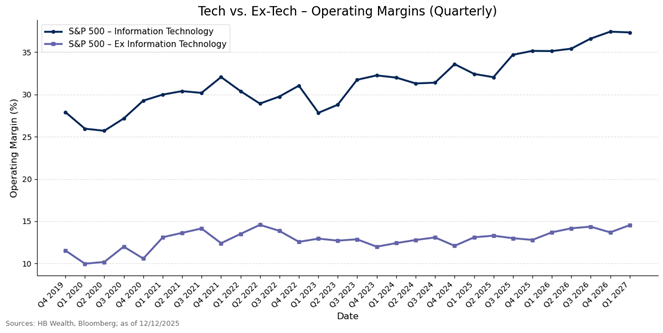
For the last several years, tech has been the primary beneficiary of productivity gains, resulting in a two-speed margin landscape for the S&P 500, and contributing to concentration risk in both earnings and prices. However, if stronger growth and lower inflation emerge, it may imply a broader recovery for S&P 500 margins.
Currently the consensus anticipates the status quo will remain in 2026 – tech is expected to record much faster margin expansion the rest of the S&P 500. Margins for tech have surged past former peaks over the last year and are expected to continue to rise to new highs by the end of 2026. Meanwhile, only modest improvement in ex-tech margins is forecasted to levels last recorded at the 2022 high. If the Fed is right and productivity gains emerge in the year ahead, presumably partly because technological advancements start to benefit non-tech industry productivity more broadly, margins may improve more than expected for non-tech companies. This margin recovery for non-tech companies could help ease the concentration risk that has plagued the index for the last several years, strengthening the fundamental backdrop for US stocks.
Disclosure: The information reflects the author’s views, opinions, and analyses as the publication date. The information is provided for informational purposes only and does not constitute an offer to sell or a solicitation of an offer to buy any investment product. This information contains forward-looking statements, predictions, and forecasts (“forward-looking statements”) concerning the belief and opinions in respect to the future. Forward-looking statements involve risks and uncertainties, and undue reliance should not be placed on them. There can be no assurance that forward-looking statements will prove to be accurate, and actual results and future events could differ materially from those anticipated in such statements. The information does not represent legal, tax, accounting, or investment advice; recipients should consult their respective advisors regarding such matters. Certain information herein is based on third-party sources believed to be reliable, but which have not been independently verified. Past performance is not a guarantee or indicator of future results; inherent in any investment is the risk of loss.
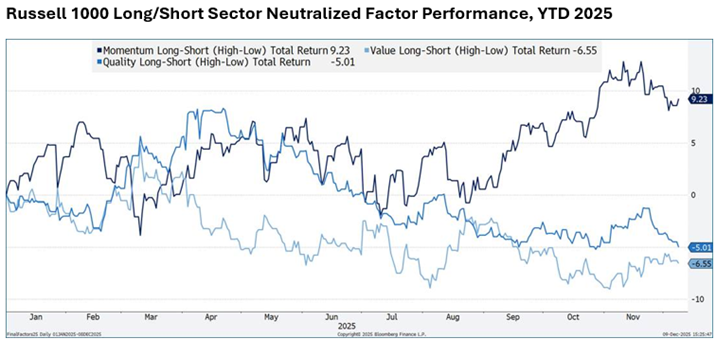
Momentum is the only major factor that is working in the U.S. large cap equity market in 2025, as well as in the bull market that began in 2023. The total return spread between high momentum and low momentum stocks is up 9% so far this year, far outpacing all other factors, which are all down at least 5%. Since the start of 2023, long/short momentum has posted a total return of nearly 20%, and the factor is the only one in positive territory.
As momentum soars, high quality and low valuation U.S. large cap stocks are underperforming their “tails” (low quality and expensive stocks) by 655 and 500 basis points, respectively, so far this year. On a rolling 12-month basis, expensive, low-quality stocks have been outperforming cheap and high-quality counterparts since October 2024.
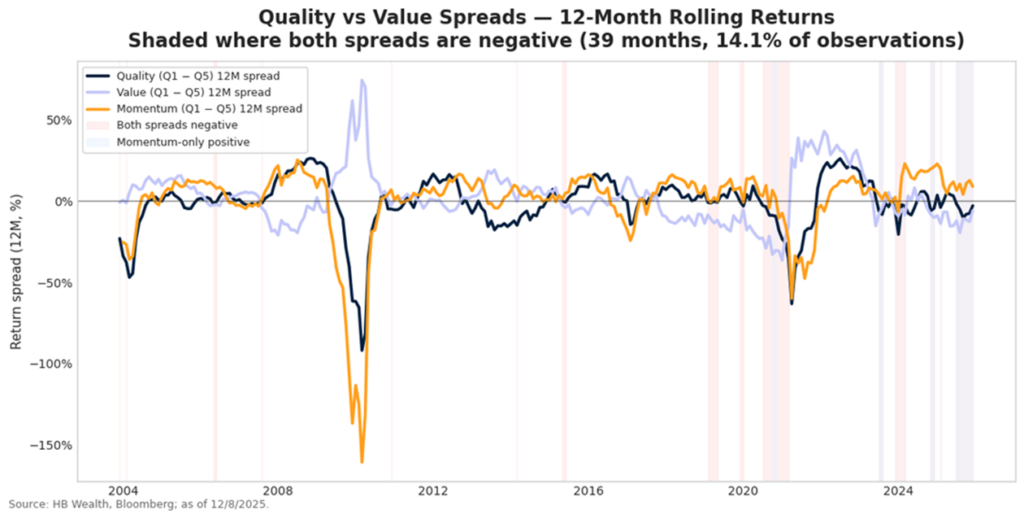
Quality and value factor correlations have shifted materially from pre-pandemic norms. Prior to the pandemic, these two factors were negatively correlated – quality worked when value didn’t, and vice versa. That has changed. In momentum’s world, quality and value factors’ fates have become rather intertwined.
HB Wealth is an SEC Registered Investment Adviser and the information provided is for informational purposes only and should not be construed as investment advice or a recommendation to buy or sell any security, cryptocurrency, or other financial instrument. Digital assets, including cryptocurrencies, are highly volatile and may not be suitable for all investors. Past performance is not indicative of future results. Investing involves risk, including the possible loss of principal. The views expressed are those of the author and do not necessarily reflect the opinions of HB Wealth. Comments for this post are not monitored. Please consult your financial advisor before making any investment decisions.
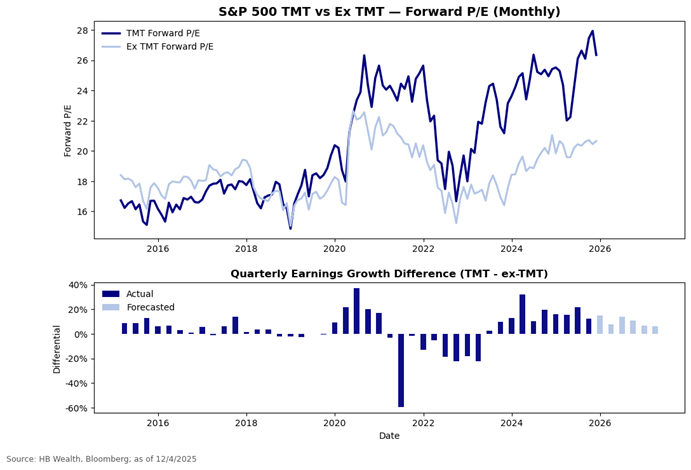
AI stocks’ earnings dominance has resulted in bloated multiples for S&P 500 tech, media and telecom (TMT) stocks, as investment dollars concentrated in the strongest growth opportunities in the index. However, the analyst consensus sees a more normalized environment for earnings emerging with policy support in 2026. This closing of the earnings gap between TMT and the rest may result in closing of the valuation gap as well.
The S&P 500 is trading at 22.4x forward earnings, a level last recorded in November 2020, but this optimistic tone is far from evenly distributed through the market. TMT multiples touched 27.9x in October, surpassing their 2021 high, while ex-TMT is still trading at multiples near 5-year average. This valuation gap could be in part explained by an earnings gap, as investment concentrated on the strongest growers in the index. Growth in TMT earnings averaged more than 20% since 2023, about four times the average growth of the rest of the S&P 500. Over the long term, TMT earnings have averaged about 4 percentage points more than the rest of the index.
The analyst consensus sees the growth gap between TMT and the rest as likely to move closer to those norms in the year ahead, and this may result in some closing of the valuation gap. Earnings for TMT should still grow faster than the rest, according to consensus, but not 4 times as fast. For 2026 and 2027, TMT may post average earnings growth of about 18% while the rest may manage 11% growth.
HB Wealth is an SEC Registered Investment Adviser and the information provided is for informational purposes only. Additionally, the information should not be construed as investment advice or a recommendation to buy or sell any security or other financial instrument. Past performance is not indicative of future results. Investing involves risk, including the possible loss of principal. The views expressed are those of the author and do not necessarily reflect the opinions of HB Wealth. Please consult your financial advisor before making any investment decisions.
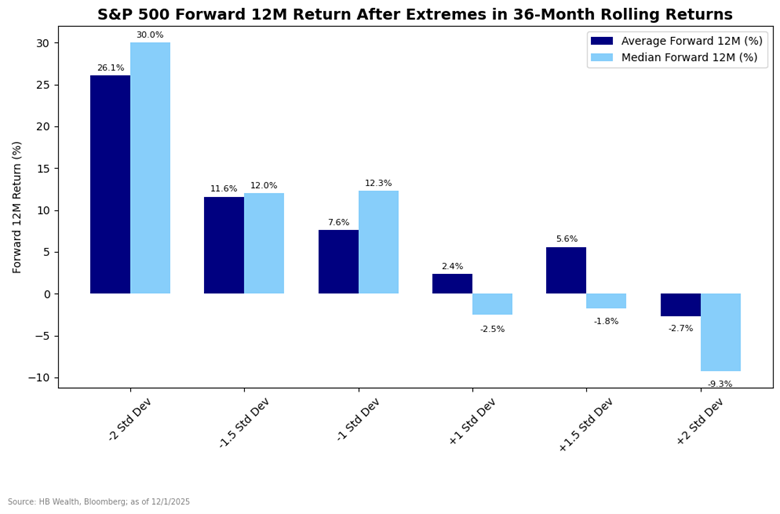
The S&P 500’s 36-Month Rolling Return neared 2 standard deviations from norm in September. The chart below shows what historically happened after extremes were reached in the measure. The more extreme the deviation, the lower the return prospects.
Likewise, such extreme deviations above norm generally lower the probability of a positive return in the forward 12 months. The index was higher about 40% of the time after at least a standard deviation surge beyond norms, while it was higher more than 75% of the time after a drop of at least a standard deviation.
HB Wealth is an SEC Registered Investment Adviser and the information provided is for informational purposes only. Additionally, the information should not be construed as investment advice or a recommendation to buy or sell any security or other financial instrument. Past performance is not indicative of future results. Investing involves risk, including the possible loss of principal. The views expressed are those of the author and do not necessarily reflect the opinions of HB Wealth. Please consult your financial advisor before making any investment decisions.
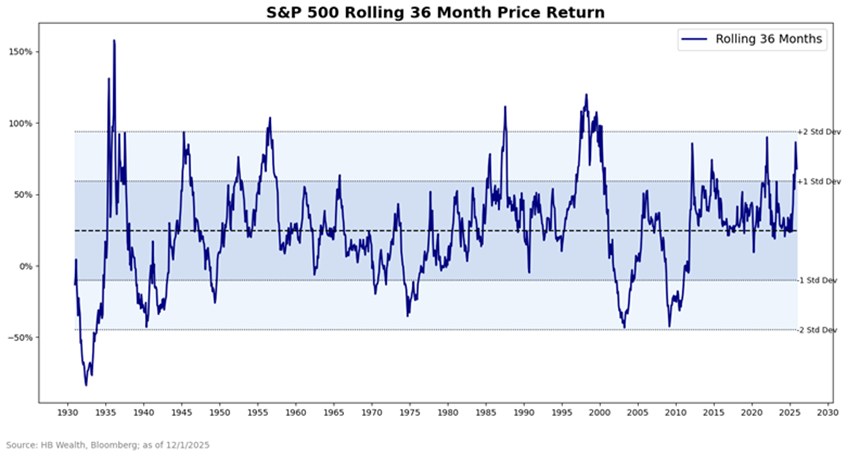
The annual prognostications for equity market returns are rolling out as the end of the year approaches, and the current strategist consensus suggests a moderate 5% return is likely. Historical patterns support these low expectations, for the S&P 500 has crossed a critical threshold that implies a strong likelihood of a slowdown in stock price growth in the year ahead.
The trailing 36-month price return reached nosebleed territory in 2025. For the first time since 2021, and only the 16th time since 1930, stocks trailing three-year return hit levels more than 1.5 standard deviations above average. Using post-WWII returns only, the 36-month rolling return nearly touched 2 standard deviations above average in September and has been easing off that high with the last two months of market churn.
Historically, slower returns tend to emerge after such extremes. On average and median, stocks have struggled after reaching at least a standard deviation above long-term average rolling 3-year returns. The more extreme the deviation, the lower the return prospects, according to history, with 2 standard deviation moves in stocks affiliated with an average forward decline of nearly 3% and median drop of 9%.
HB Wealth is an SEC Registered Investment Adviser and the information provided is for informational purposes only. Additionally, the information should not be construed as investment advice or a recommendation to buy or sell any security or other financial instrument. Past performance is not indicative of future results. Investing involves risk, including the possible loss of principal. The views expressed are those of the author and do not necessarily reflect the opinions of HB Wealth. Please consult your financial advisor before making any investment decisions.
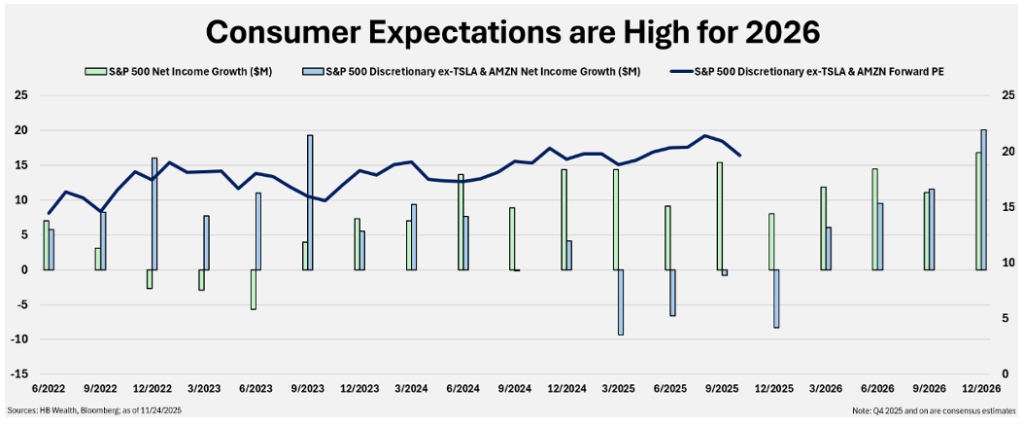
Thanksgiving week normally kicks off a period of positive seasonality in stocks, in part because the U.S. consumer rarely disappoints during the holiday season. But high market expectations for recovery in 2026 may be tough for the consumer to overcome in the year ahead. Consensus and market implied expectations for growth in the consumer discretionary sector are elevated relative to norms, and in the face of very low confidence levels and slow retail sales growth.
Discretionary stocks (excluding high tech companies Amazon and Tesla) are on track to post a decline in earnings year-over-year for a fourth consecutive quarter in 4Q, implying that low holiday sales expectations may be fairly easy for consumers to hurdle. However, after 4Q, earnings growth is expected to surge back into positive territory, with 6.6% average growth in 2026. Easy comparisons to 2025 certainly help, but nonetheless this forecast is for growth to double the sector’s norm. The group averaged 3.6% growth quarterly in the five years prior to the pandemic.
Likewise, valuations for the segment are extended relative to historical norms. On a forward basis, the PE multiple for ex-AMZN and TSLA consumer discretionary is 19.6x, or 29% above pre-pandemic 5-year average.
Even as nominal sales have grown 7.8% from the beginning of 2023 to date, real sales have dropped 0.2%, evidence that the consumer is continuing to tread water. Meanwhile, confidence continues to languish near all-time lows. While policy support in the form of lower interest rates as well as tax refunds could help revive consumer trends and support stocks, deteriorating job growth, low consumer confidence and poor spending trends are all conspiring to spoil the market’s forecast in 2026.
HB Wealth is an SEC Registered Investment Adviser and the information provided is for informational purposes only. Additionally, the information should not be construed as investment advice or a recommendation to buy or sell any security or other financial instrument. Past performance is not indicative of future results. Investing involves risk, including the possible loss of principal. The views expressed are those of the author and do not necessarily reflect the opinions of HB Wealth. Please consult your financial advisor before making any investment decisions.

International stocks are on their way to their first year of outperforming domestic stocks since 2017, and strengthening earnings, discounted valuations, and dollar depreciation may all continue to make the case for global shares to perform well into 2026.
U.S. stocks (represented by the Russell 1000) are up 13% so far this year but have been outpaced by international counterparts. Emerging and developed market (ex-US) equities (represented by MSCI indices) are up 27% and 24%, respectively Emerging markets are on pace for their best year since 2019 while developed markets outside of the US are set for a gain last matched in 2017.
US stocks have been outpaced by either emerging markets or developed markets in just 2 of the last 12 years, making 2025 appear as a relative anomaly. But several signals, including earnings, valuations, and the dollar all suggest this year may mark the beginning of a new performance dynamic in global equities. Earnings growth was a support to many non-domestic markets in 2025 that may persist in 2026.
Emerging markets at large are on track to post more than 12% earnings growth in 2025, despite modest growth in China, and developed markets like Canada likewise topped US growth. While analysts expect US growth to strengthen from about 10% this year to 13% in 2026, a strengthening earnings recovery in China could carry Emerging market growth to 18% next year. Canada, Germany, France and Italy are all likewise expected to post growth faster than the US.
Meanwhile, valuations still point to discounts available in international equities, while the US trades at an extraordinary premium. Emerging market equities trade at 12.9X forward estimates while developed market shares outside the US command 15.3X, both still well below the US multiple of 21.4X. Despite the relative strengthening in earnings prospects outside of the United States, international stocks still trade at a discount 1.7 standard deviations below 20-year average when compared to the US market.
Dollar depreciation has also historically correlated with excess global equity market returns, and easing policy at the Fed, escalating debt and budget deficit, and uncertainty over the trade policy landscape all may make a case for continued dollar weakness in the year ahead. The US dollar has been negatively correlated to Emerging Markets equities 80.5% of the time and Developed Markets equities 90.7% of the time over rolling 60-day periods since March 2010.
HB Wealth is an SEC Registered Investment Adviser and the information provided is for informational purposes only. Additionally, the information should not be construed as investment advice or a recommendation to buy or sell any security or other financial instrument. Past performance is not indicative of future results. Investing involves risk, including the possible loss of principal. The views expressed are those of the author and do not necessarily reflect the opinions of HB Wealth. Please consult your financial advisor before making any investment decisions.