So far this year, 18 of the 19 largest country markets in the world are outperforming the US equity market. This vast outperformance is better than any start to the year since 2005, when all 19 markets outperformed the US. Yet, a persistent valuation gap between the US and the rest of the world remains. Both growth dynamics and profitability shifts now imply this valuation gap should close, and this may drive international equity outperformance for some time to come.
US Growth Premium is Fading, and Leaves an Unseemly Valuation Gap
The growth momentum that favored the US in recent years may be set to fade in the near term. In 2023-2025, US earnings growth averaged 8.9% while global earnings growth averaged 3.7%. This helped make the case for US stocks. In 2026-27, US earnings are expected to grow about 14% on average annually, but global earnings are expected to rise at an average pace north of 20%. Likewise, the IMF projects world growth will accelerate more than 3% over the next two years while US growth should average just over 2%.
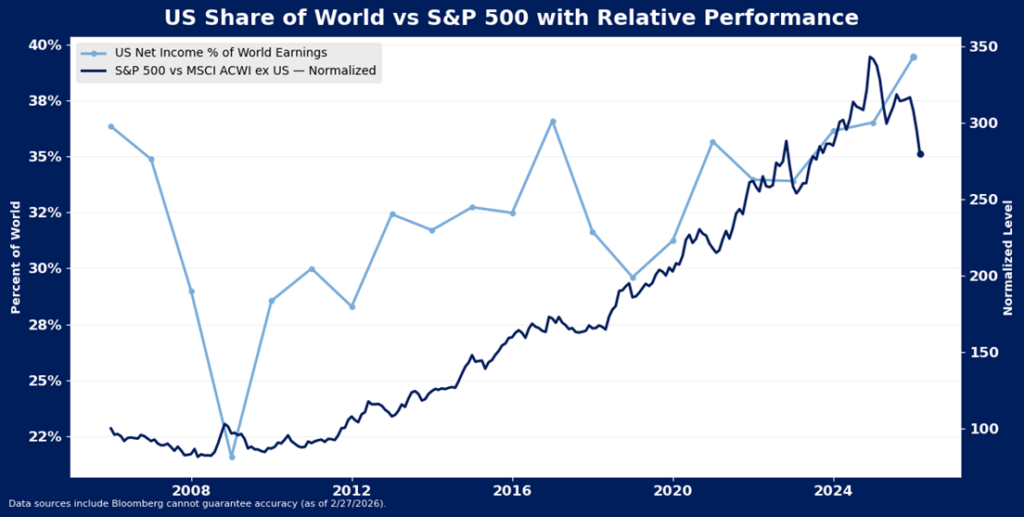
Elevated relative earnings growth for the US drove an improvement in relative price performance for the region that may prove unsustainable in an environment where international equity earnings are set to grow at a faster pace, particularly considering that concentration in US stocks has become extreme relative to actual share of growth. US stocks are now more than 60% of the market cap of the global investable equity market according to MSCI, well above levels justified by the country’s share of economic or earnings growth. As of the end of last year, US GDP was just 26.9% of world growth, and US earnings were 33.8% of global earnings. Put another way, non-domestic economies are nearly 3/4ths of global GDP and non-domestic earnings are nearly 2/3rd of global earnings, but they command less than half of global equity market cap.
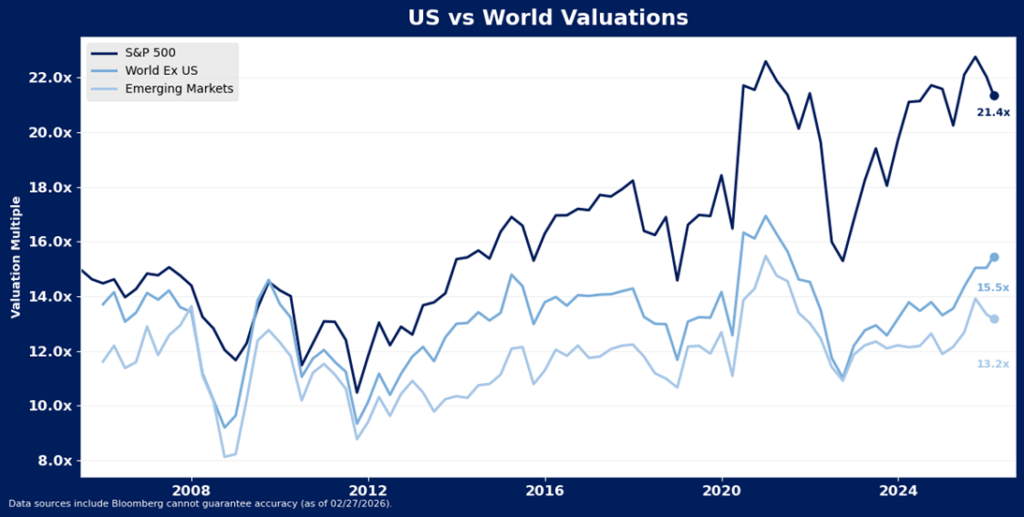
US equity valuations are now very elevated relative to valuations for global stocks, despite evidence of shifting near term growth momentum. At 21.5X forward 12-month earnings, the S&P 500 trades a full 6X above non-domestic equities, represented by the Bloomberg World Index excluding the US. This is 2.7x above long-term average, and even higher than the spread that emerged in 2021, when U.S. stocks last reached extreme valuations. The spread to emerging markets is still especially wide, with the Bloomberg Emerging Markets Index P/E still sitting at only 13X.
US Valuation Premium Too High for Margin to Support, May Fade with AI-Theme Profitability
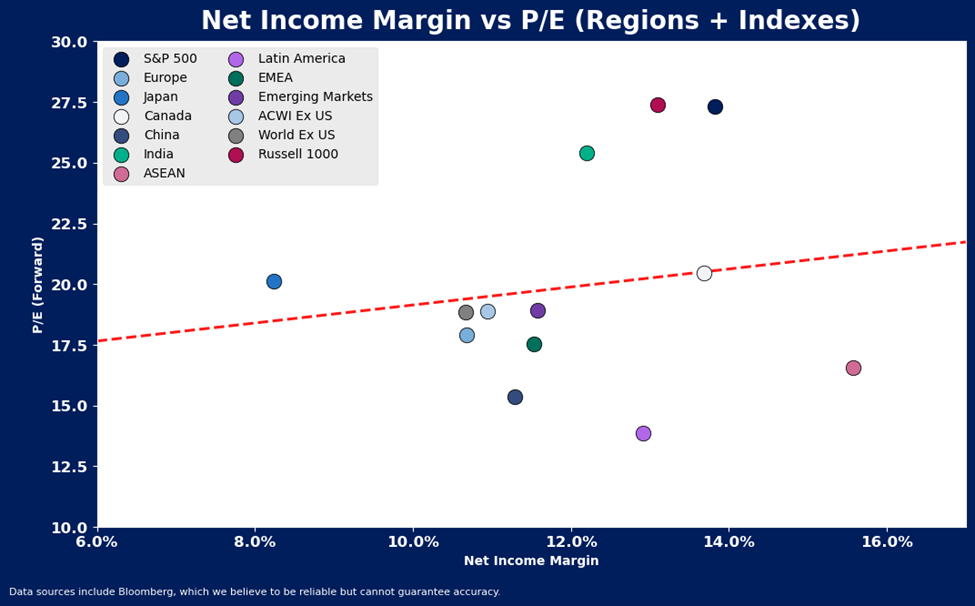
U.S. valuations appear somewhat bloated even considering that US margins are higher than most of the rest of the world. Net income margins of ASEAN equities are materially higher than US net income margins, and Canada and Latin American corporate margins are likewise in line with US margins. Yet, all of these markets trade at significant discount to US stocks. Meanwhile, all world equity markets with the exception of Japan and India trade at discounts to levels that would be implied by net income margin.
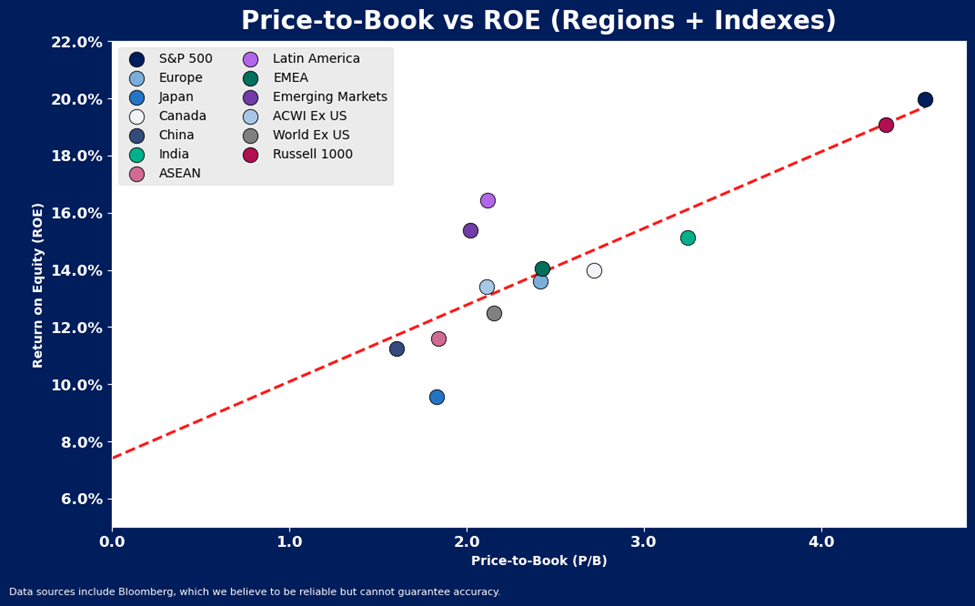
Perhaps even more importantly, US valuations appear to presume that US profitability and capital efficiency will remain extremely strong, even in the face of eroding hyperscaler cash flow amid ever-increasing capital spending plans. US price to-book ratios appear about in line with current ROE and ROIC, but also assume high ROE and high ROIC in the US will persist, even though those measures are heavily skewed by the highest market cap stocks (aka, the Mag-7). U.S. price-to-book is 2X price to book for the rest of the world, supported by the fact that ROIC and ROE are also about 2X the rest of world on a market cap-weighted basis. However, on median, US ROIC and ROE are much closer to measures for the rest of the world. Median US ROIC and ROE are both about 1.3X rest-of-world medians, while US median P/B is about 1.5X rest-of-world median P/B. The distorted ratios suggest US market valuations are heavily dependent on a sustained elevated level of profitability for the market’s largest stocks, which are generally companies tied to the AI theme.
After years of concentrated gains in the US, valuations became over-extended, not only in absolute terms, but relative to global counterparts. This was in part due to elevated growth and profitability of US companies. However, the valuation gap between US and global stocks may now be in the early stages of closing. Global stocks outperformed the U.S. equity market in 2025 and are continuing to do so in 2026. Shifting relative growth prospects and changing assumptions about profitability and capital efficiency among the largest US companies appear likely to keep closing the gap as the year progresses.
Disclosure: HB Wealth is an SEC-registered investment adviser. The information reflects the author’s views, opinions, and analyses as the publication date. The information is provided for informational purposes only and does not constitute an offer to sell or a solicitation of an offer to buy any investment product. This information contains forward-looking statements, predictions, and forecasts (“forward-looking statements”) concerning the belief and opinions in respect to the future. Forward-looking statements involve risks and uncertainties, and undue reliance should not be placed on them. There can be no assurance that forward-looking statements will prove to be accurate, and actual results and future events could differ materially from those anticipated in such statements. The information does not represent legal, tax, accounting, or investment advice; recipients should consult their respective advisors regarding such matters. Certain information herein is based on third-party sources believed to be reliable, but which have not been independently verified. Past performance is not a guarantee or indicator of future results; inherent in any investment is the risk of loss.