


Elevated fiscal spending, easy monetary policy, trade tensions and geopolitical strains may imply inflation risk is re-emerging in 2026. This could take consensus views, focused more squarely on potential job losses as AI-initiatives are implemented, off guard this year. Materials and energy are two of the top performing sectors in large cap stocks year-to-date, as commodity prices surge. Services companies, in particular, are reporting elevated prices. Historically, inflation is only problematic for stocks in two instances – (1) when consumer prices accelerate faster than 3.5%, and (2) when producer prices rise faster than consumer prices. Consumer prices are not rising so quickly that they are likely to compress market valuations (tech stocks are doing that job quite nicely anyway!). However, producer prices are now rising faster than consumer prices. This suggests the profits outlook may be more troubled than is commonly believed.
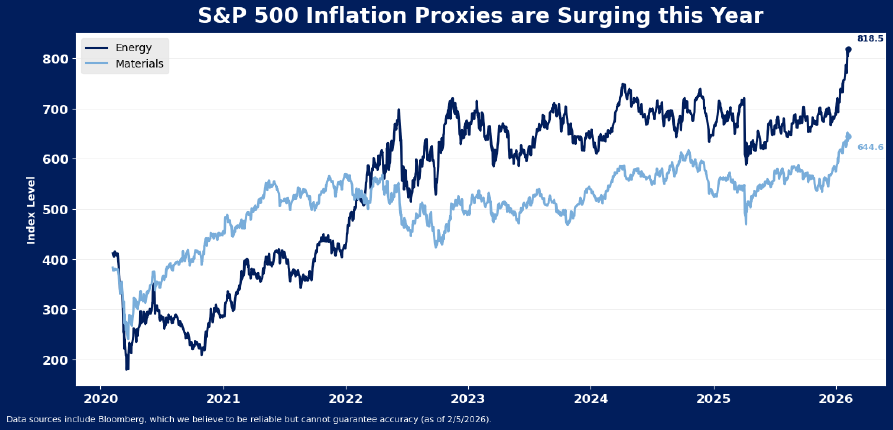
While in the intermediate term, there may appear little risk of a broad inflation breakout, a few indicators are starting to flash yellow with respect to inflation. Notably, energy and materials stocks are having their best start to the year in some time, as the combination of monetary and fiscal easing in 2025 may be starting to impact pricing and activity in 2026. Both sectors recorded their strongest 1-month gains in January since October 2022 and June 2023, respectively.
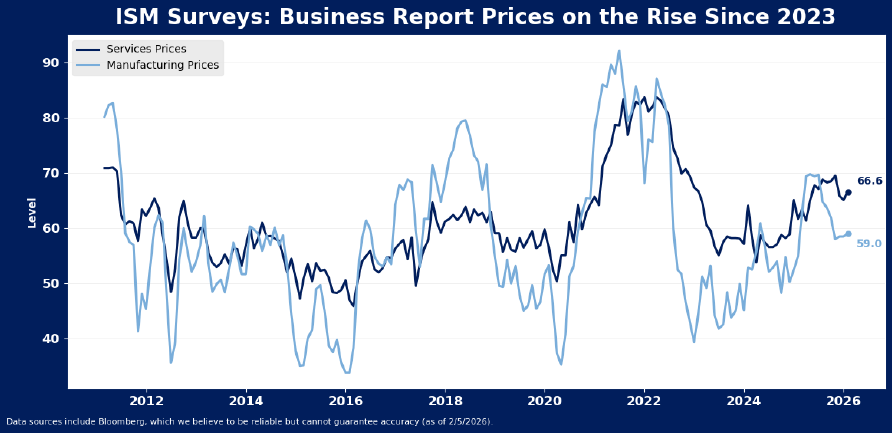
Meanwhile, businesses report services prices remain elevated. Though both services and goods prices have been slowly increasing from their 2023 lows for more than two years, services costs are still higher than any point in the pre-pandemic cycle. All 17 industries in the ISM services index reported an increase in prices paid in January, suggesting remarkable breadth in pricing pressure for services.
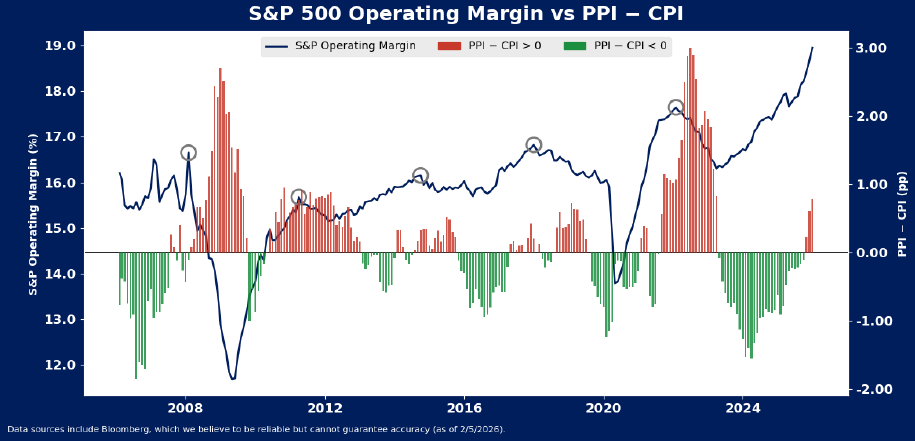
And importantly, the spread between producer and consumer prices is suggesting pricing pressure may be starting to emerge, and this may throw a bit of cold water on margin forecasts for the S&P 500. The spread between these indicators can operate as a proxy for company pricing power. Historically, when core producer prices accelerate faster than core consumer prices, particularly when producer price growth is above 3%, companies struggle to pass along costs. This struggle manifests in margin weakness for S&P 500 companies.
Our chart shows the spread plotted against index margins over time. Each time PPI accelerated faster than CPI, index margins reached a near term peak. This last happened in 2022, but it also happened in 2018, 2015 and 2011. In each period, markets weakened for various reasons, but in all periods, profitability of U.S. companies slumped a bit under the pressure of elevated inflation.
These inflation signals should be watched carefully as the year progresses, for it is early to suggest inflation is yet a problem for stocks. Pricing issues may need to deepen before they become a major drag on stocks or trouble the economy. From a broad perspective, stocks valuations usually do not react to inflation pressures until CPI accelerates beyond 3.5%. This reflects the historical tendency for the Fed to allow inflation to run slightly hotter than the loose 2% stated target. Over the long run, CPI has averaged 3%, and equity market valuations average north of 20X when inflation is below 3.5%, as is still the case. Above 3.5%, the market has historically experienced a material downdraft in valuations.
Disclosure: HB Wealth is an SECregistered investment adviser. The information reflects the author’s views, opinions, and analyses as the publication date. The information is provided for informational purposes only and does not constitute an offer to sell or a solicitation of an offer to buy any investment product. This information contains forward-looking statements, predictions, and forecasts (“forward-looking statements”) concerning the belief and opinions in respect to the future. Forward-looking statements involve risks and uncertainties, and undue reliance should not be placed on them. There can be no assurance that forward-looking statements will prove to be accurate, and actual results and future events could differ materially from those anticipated in such statements. The information does not represent legal, tax, accounting, or investment advice; recipients should consult their respective advisors regarding such matters. Certain information herein is based on third-party sources believed to be reliable, but which have not been independently verified. Past performance is not a guarantee or indicator of future results; inherent in any investment is the risk of loss.

