


U.S. equity markets’ rotation out of technology has come a long way over the last few months, and the sector is now trading at just a 10% premium to the rest of the market. The sector’s earnings may justify a modest premium to the index, but only if growth can remain very strong. If relative earnings momentum fades as the consensus expects, it may suggest more valuation pressure for the group, and if valuations for tech – the largest sector in the index by market cap – stall or fall, a continued struggle for stocks is likely. Over the long run, the S&P 500 posts stronger returns in periods when tech stocks’ multiples are rising, and that seems unlikely as unusual post-pandemic economic trends normalize.
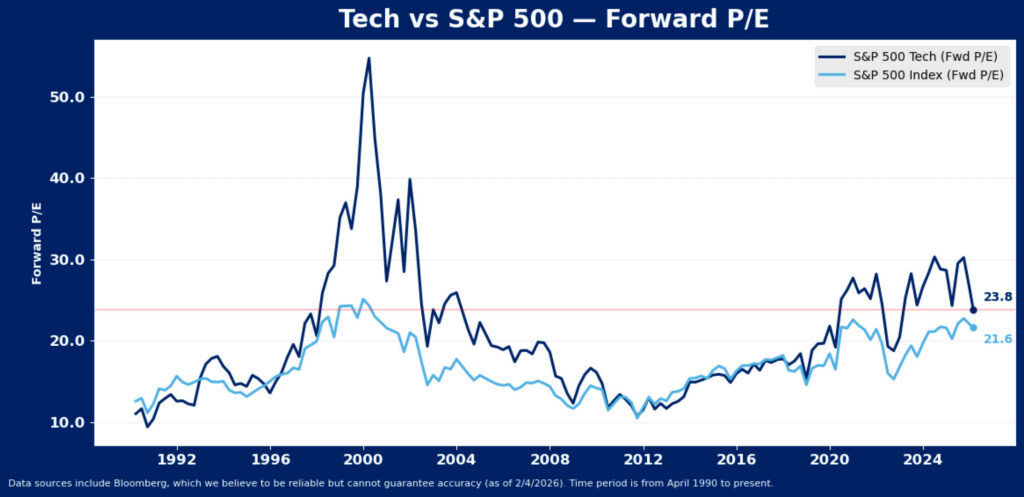
After leading the S&P 500 with a rally of more than 70% from the spring 2025 low to the October 2025 high, tech stocks have sold off 11.5%, pushing the sector’s forward P/E multiple back to 23.6x from its peak above 30X. This is still higher than 86% of history back to 1990, and comparable to levels recorded in 2002, as the tech bubble was in the process of deflating. However, it has started to close the sector’s valuation gap to the rest of the index. The former 40% tech premium has been cut to 10%, but it is still above ex-bubble norms – tech has historically traded in line with the index except during the tech bubble and during the AI-craze. Notably, the premium developed during the tech bubble reached significantly higher extremes and took years to normalize. Tech’s premium is much lower this time but is nonetheless still creating some tumult for stocks as it normalizes.
Loss of momentum in the AI trade that powered tech to new high valuations is the culprit behind the latest decline, in similar fashion to the same issue that plagued tech in early 2025. However, back then, tech sector valuations recovered smartly because tech earnings growth proved more resilient than the rest of the index. Tariffs, while less onerous than anticipated, effectively stalled out the budding recovery in the rest of the index in 2025 while tech enjoyed another leg of AI investment-led growth. With tech proving a reliable growth engine, particularly by comparison, capital pushed back into the segment, elevating valuations.
Neither of these trends – tariffs stifling ex-tech growth or tech getting another leg up from AI – appears likely to emerge this year. Ex-tech earnings growth is expected to continuously accelerate this year as tech earnings growth hits a peak in the current quarter.
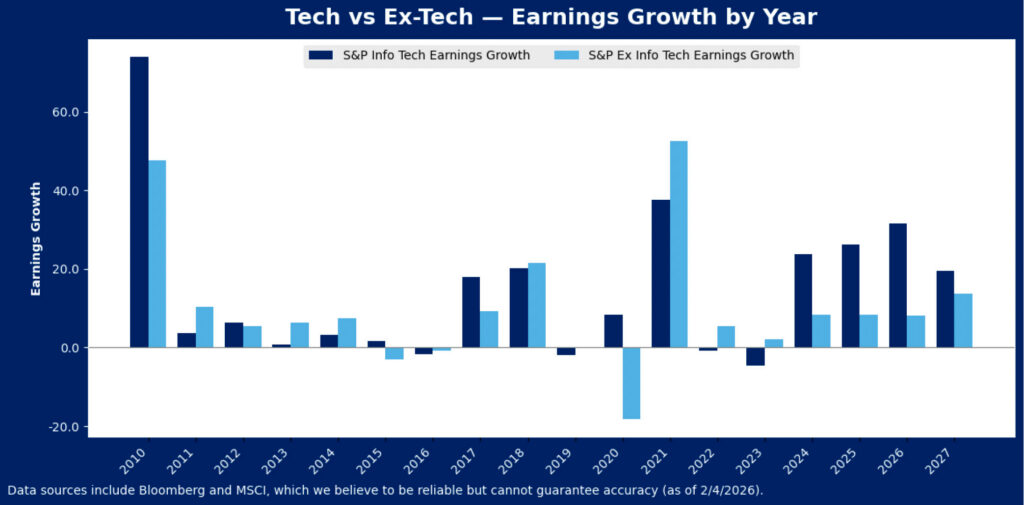
This may mean tech sector valuations will continue to stall out. During the period between the financial crisis and pandemic, tech sector earnings growth was about 20% faster than ex-tech sectors of the S&P 500 on average. Since the pandemic, tech’s earnings growth has been 50% stronger than the rest of the index, with average annual growth of 15.1% since the end of 2020 compared to ex-tech’s average growth of 9.8%. The tech growth phenomenon resulted in valuation expansion for the group, as ever-stronger earnings growth was continually experienced, and extrapolated. The consensus now sees a smaller growth premium as likely to start to emerge this year and next. If this proves correct, the premium that has become the norm in the post-pandemic world is no longer justified.
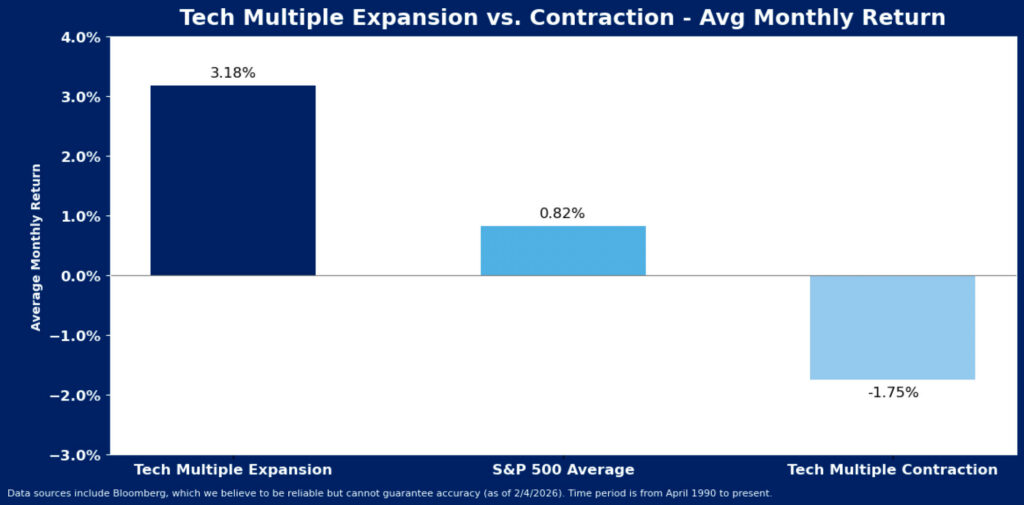
Considering the degree to which tech stocks have corrected over the past three months, the broad market is holding up reasonably well. Nonetheless, market returns can be expected to be muted when the tech sector valuations are not expanding. On average, when tech stocks de-rate, the broad market has struggled with lower returns. Since April 1990, when tech valuations fell, the average monthly S&P 500 return was -1.8%. In contrast, when tech stocks’ multiples rose, stocks post stronger monthly returns that averaged 3.2%. Over the last three months, even though tech stocks have dropped more than 10% and valuations have dropped about 7X, the index has posted below average, but nonetheless slightly positive average monthly returns. Rotation to the other groups in anticipation of strengthening earnings trends ex-tech has helped shelter the index from tech’s struggles. Without tech sector enthusiasm, these groups will need to continue to show strong recovery prospects to keep equities afloat.
Disclosure: HB Wealth is an SECregistered investment adviser. The information reflects the author’s views, opinions, and analyses as the publication date. The information is provided for informational purposes only and does not constitute an offer to sell or a solicitation of an offer to buy any investment product. This information contains forward-looking statements, predictions, and forecasts (“forward-looking statements”) concerning the belief and opinions in respect to the future. Forward-looking statements involve risks and uncertainties, and undue reliance should not be placed on them. There can be no assurance that forward-looking statements will prove to be accurate, and actual results and future events could differ materially from those anticipated in such statements. The information does not represent legal, tax, accounting, or investment advice; recipients should consult their respective advisors regarding such matters. Certain information herein is based on third-party sources believed to be reliable, but which have not been independently verified. Past performance is not a guarantee or indicator of future results; inherent in any investment is the risk of loss.

