Can the Bull Keep Charging in 2026?

A person stands on a rocky peak overlooking mountains under a blue sky. Text reads: “Market Sense by HB Wealth. Can the Bull Keep Charging in 2026? December 22, 2025.”.
Bar chart showing annual returns of the S&P 500 from 1925 to 2025. Bars are colored by previous 3-year returns: blue for default, medium blue if >15%, and dark blue if >20%. Returns vary widely, with notable dips and spikes.

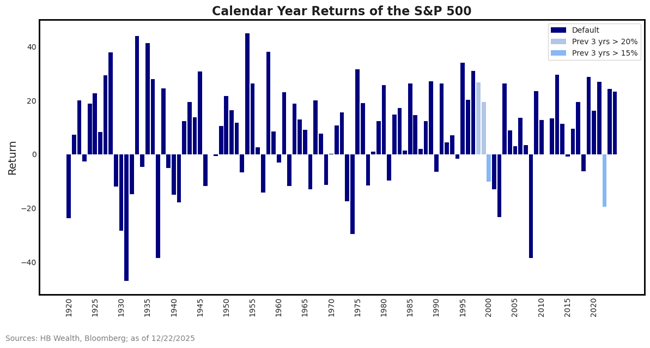
The S&P 500 is on pace for a third consecutive year of more than 15% price growth, and if a Santa Claus rally takes shape in the final trading days of the year, it could hit rare air with a third straight year of 20% growth.  There is little historical precedent for extreme moves such as that which has just occurred in equity markets.  Yet, if Wall Street analysts are correct, stocks may post a fourth year of double-digit gains in 2026, pushing the bull market to join only the 1990s tech bubble in duration and degree.

Stocks have recorded three straight years of 15% just twice since the early 1920s – in the late 1990s and surrounding the pandemic – and three straight years of 20% growth occurred only during the tech bubble.  After the 15%+ occurrences, the average gain in the 4th year was 4.2%, with stocks up 19.5% that following year in the 90s but down 19.4% in 2022.

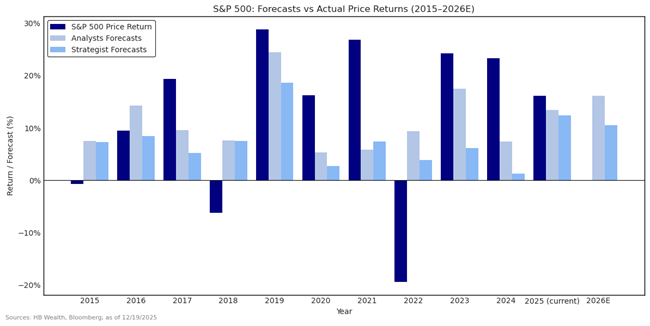
Wall Street analysts have a recent history of underestimating growth in stocks in years when stocks rise but got closer to predicting the return of the stock market last year than any year in the last ten.  This time last year, bottom-up analysts forecasted price growth of 13% for the S&P 500 and the average top-down strategist estimate was for 12% growth.  The combined group of forecasters was the most optimistic since 2018, when the group average forecast was for a 22% gain in stocks the following year.  (That estimate also proved to be a bit low.)

On average over the last 10 years, analysts have underestimated stocks’ price growth by 1% per year while strategists underestimated by 5% per year.  However, that includes major misses in the years when stocks fell. Indeed, overestimations only occurred for the years when stock prices fell.  Forecasters have not predicted stocks would fall any year in the last ten. In the years that stock prices rose, analysts thus underestimated price growth by 10 percentage points and strategists underestimated the index gain by 15 percentage points, on average.

Analysts are now forecasting 16% price growth for the index while strategists are targeting about 10%, resulting in an average price growth forecast about the same as a year ago.  If they are right, the current bull market will surpass the duration and degree of the pandemic bull. Only the 1990s tech bubble will offer historical comparison.

Bar chart comparing S&P 500 actual price returns and forecasts by analysts and strategists from 2015 to 2026E. Actual returns vary widely while forecasts are more stable; future years are shown as estimates.

Disclosure: The information reflects the author’s views, opinions, and analyses as the publication date. The information is provided for informational purposes only and does not constitute an offer to sell or a solicitation of an offer to buy any investment product. This information contains forward-looking statements, predictions, and forecasts (“forward-looking statements”) concerning the belief and opinions in respect to the future. Forward-looking statements involve risks and uncertainties, and undue reliance should not be placed on them. There can be no assurance that forward-looking statements will prove to be accurate, and actual results and future events could differ materially from those anticipated in such statements. The information does not represent legal, tax, accounting, or investment advice; recipients should consult their respective advisors regarding such matters. Certain information herein is based on third-party sources believed to be reliable, but which have not been independently verified. Past performance is not a guarantee or indicator of future results; inherent in any investment is the risk of loss.

A woman with long brown hair wearing a blue blazer and a necklace smiles at the camera. The background is softly blurred with light and blue tones.

Gina Martin Adams, CFA, CMT

Chief Market Strategist, Shareholder

Gina Martin Adams, CFA, CMT, is the Chief Market Strategist for HB Wealth. With more than 25 years of experience at leading global financial institutions, Adams brings deep expertise in market analysis, thematic research, and translating complex economic trends into actionable strategies. She collaborates with HB Wealth’s investment team to deliver timely market perspectives, share actionable insights, and enhance the firm’s visibility as a leading voice in the industry. She contributes to advancing proprietary research, supporting the development of new investment products, and enhancing the client experience through thought leadership and education. She pursues a top-down perspective and model-based approach, leveraging fundamental, technical, and quantitative perspectives to inform investment decisions, and frequently presents her views in the media and at industry conferences, professional associations and investment organizations.

A young man with short brown hair, wearing a dark suit, white shirt, and blue tie, stands in front of a blurred background with lights and blue tones.

Matthew

Senior Investment Research Analyst

Related Insights & News

View from an airplane window showing a wingtip against a clear blue sky, with scattered white clouds over a vast landscape below.

Global Mobility: Key Considerations for High-Net-Worth Families

Global mobility strategies, such as alternative residency or citizenship programs, are increasingly part of conversations…

Read More

A person stands on a mountain peak overlooking blue hills. Text reads: Market Sense by HB Wealth. Can Lower CPI Boost Stocks? December 19, 2025.

Can Lower CPI Boost Stocks?

After rising for the bulk of the summer, consumer prices finally eased somewhat this fall,…

Read More

A winding dirt road runs through a green field under a blue sky with clouds. Text reads “2025 Market Themes & Developments.” The image includes the HB Wealth logo in the bottom right corner.

Markets in 2025: Key Themes and Developments Shaping the Year Ahead

2025 was a year marked by heightened volatility, fast-moving headlines, and shifting policy dynamics. Markets…

Read More

A person with a backpack stands on a mountain ledge overlooking blue hills. Text reads: Market Sense by HB Wealth. Equity Valuation Model Suggests it’s Time for New Leadership to Emerge. December 17, 2025.

Equity Valuation Model Suggests it’s Time for New Leadership to Emerge

Stocks rallied on welcome news of another round of liquidity provision and brightening growth from…

Read More

The above is not a recommendation to purchase or sell a particular security and is not legal, investment or tax advice. Results are not guaranteed. All investing involves risk.

Past performance is not a guarantee of future results for any investment. Private alternative investments are not for every client. An individual must be qualified to invest in a private investment based on their net worth and/or other criteria, and they may qualify to invest in some alternative investments while not being allowed to invest in other alternative investments. Alternative investments are not risk-free and there is no guarantee of achieving attractive performance compared to similar liquid investments. Risks associated with investments in private alternatives include the illiquid nature of such investments, risks associated with leveraged investments, manager-specific risks, sector-specific risks, and in certain cases geographical risk, as well as the risk of loss of principal.