


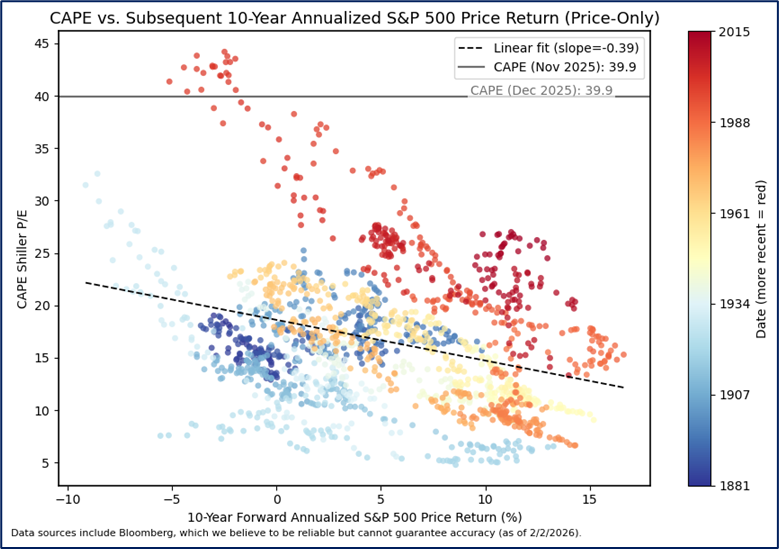
U.S. large cap stocks ended 2025 in rare valuations territory, with the cyclically adjusted PE ratio (CAPE) of 39.9 in the 99th percentile of all observations since 1881. US stock valuations by this measure are near 150-year highs, well north of the long-term average of 17.7, and even substantially higher than the recent 10-year average CAPE of 31.5. According to mean reversion theory, very poor market returns are likely to emerge with valuations this high. But decades of evidence show that these theories are highly flawed and very unreliable for shorter term return expectations. Our valuation model is based on current economic conditions rather than long term trends. It also suggests we should lower our expectations for returns in the short run. It does not, however, support the dire forecasts implied by mean-reversion assumptions embedded in CAPE analysis.
Cyclically adjusted valuation, as represented by the CAPE ratio, is designed to smooth out the effect of business cycles by averaging and inflation-adjusting the “E” in the P/E ratio over 10 years. That ratio is then meant to enable long-term return assumptions for stocks – higher CAPE is affiliated with lower long-term returns, and vice versa. While this method shows some efficacy in predicting returns over the long term, the relationship has shifted over time, and the recent track record is dubious at best.
Ten years ago, at the start of 2016, the CAPE ratio stood at 24.2. At the time this was in the 89th quartile of history, and implied 2.1% average annual returns were likely. Stocks posted 14% average annual returns over the last decade. Likewise, five years ago, the CAPE ratio was in the 98th percentile, implying -0.5% annualized returns were looming. Over the last five years, and including a very large correction in 2022, the S&P 500 has posted average annual gains of 14.3% per year for the last five years.
No valuation model is perfect, and multiples should be used as just one tool in the toolkit for evaluating potential market returns. One of the biggest flaws in the model may simply be the assumption of mean reversion, for valuations have shifted meaningfully over time. Thus, time period selection for defining a mean can make a rather large difference in the model’s implied forward return assumption. The current 10-year trailing mean CAPE is 31.5 while the 20-year mean is 27.3, and the 50-year mean is 22.6. Which is the correct time period for assuming mean reversion? Should “expensive” 100 years ago also be considered “expensive” today? CAPE assumes so, but the market appears to see it differently.
A CAPE of 25-30X in the 1920s and 1930s resulted in negative 10-year forward returns, but that same CAPE range in the 1980s and 1990s led to positive annualized returns over the subsequent 10 years. Long-term average equity market returns have been persistently higher for the last 50 years than they were in the 50 prior years, and recent years offered stronger average returns than in preceding decades despite elevated valuations. Long term market returns thus appear at best to have a loose relationship with valuations.
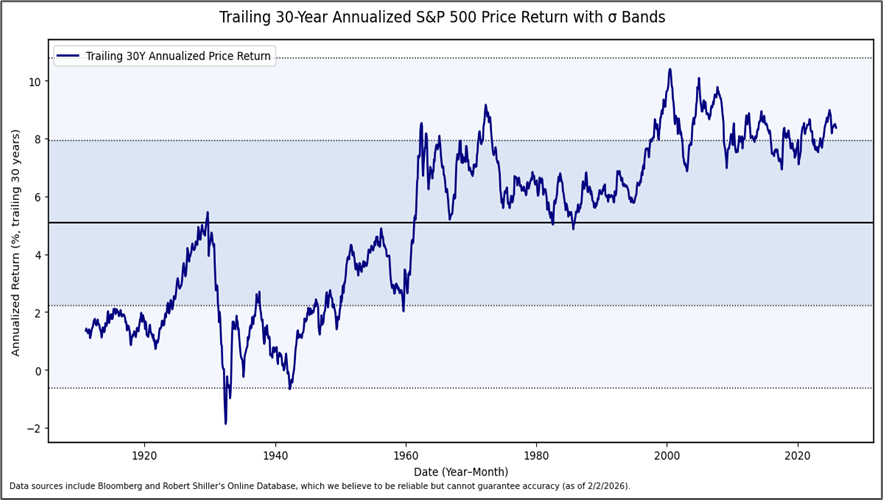
For many reasons, comparing today’s market multiples to past periods is fraught with peril. One of those reasons is the supply and demand landscape for US stocks, which is certainly constantly evolving with issuance, access and appeal. Over time, and especially over the last few decades, stocks valuations have trended higher as relatively scarce supply has been met with persistent and growing demand for public equity investment. If too much capital continues to chase too few equities, comparisons to the long-term past may prove faulty and CAPE may remain a poor predictor of forward market returns.
An alternative approach to using mean-reversion valuation assumptions may be to assess valuations based on timelier market cues and earnings conditions. While this model has a shorter-term focus than the CAPE model, and it is also imperfect given that the market is not precisely reflective of any subset of macroeconomic indicators, it nonetheless shows a strong quantitative fit between current market variables and valuations. We can observe what the variables imply for future returns based on what they meant for stocks in the recent past.
Based on current consensus expectations for the 2-year and 10-year Treasury yields, as well as forecasts for earnings growth to rise about 14% per year for the next two years, our regression model for US large cap stocks suggests the S&P 500 should trade closer to 19X earnings versus its current P/E ratio of about 22x.
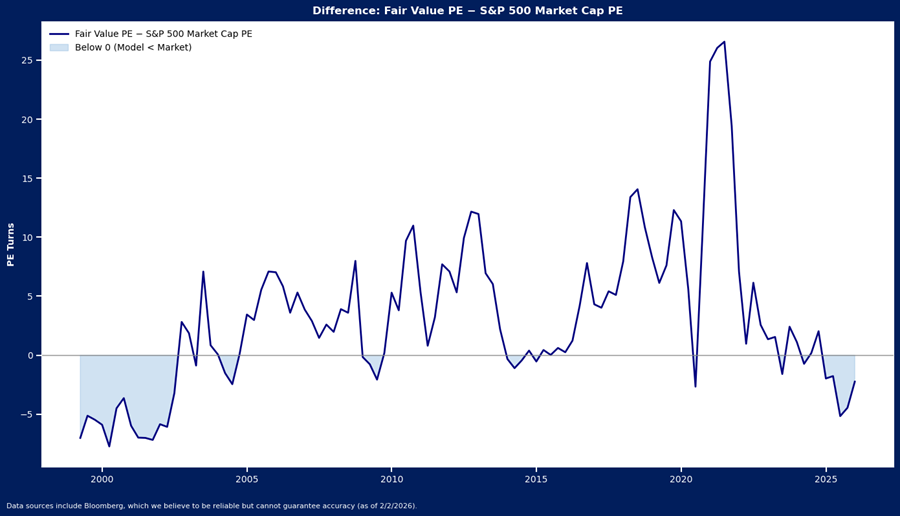
Notably, current market cues do not confirm a reversion to long term mean valuations is imminent, but they do imply a lower multiple is likely, and this may slow down the recent torrid pace of equity market returns. In periods when the market P/E was above our model estimate over the last 25-years (as it is now), stocks averaged forward 12-month returns of 3.1%, and a median 5%. It also may help us identify the source of returns. As multiples reach levels above that supported by the indicators, earnings are more likely to be the primary return driver for equities. Our model suggested the composition of returns was likely to shift at the end of 2024, when multiples first pushed above indicated fair value. While returns exceeded expectations in 2025, the source of return clearly shifted to earnings from valuation expansion.
In sum, while the current economic environment suggests multiples may be more likely to compress to align with the rates landscape, it does not suggest a long-term period of negative returns is necessarily imminent. Instead, there is some support for valuations to remain higher than long term averages, just perhaps not as high as they currently are. Earnings growth could continue to offset downside that emerges with valuation pressure, effectively slowing down the pace of the bull charge in stocks, but not necessarily tipping the bull over entirely.
Disclosure: HB Wealth is an SEC‑registered investment adviser. The information reflects the author’s views, opinions, and analyses as the publication date. The information is provided for informational purposes only and does not constitute an offer to sell or a solicitation of an offer to buy any investment product. This information contains forward-looking statements, predictions, and forecasts (“forward-looking statements”) concerning the belief and opinions in respect to the future. Forward-looking statements involve risks and uncertainties, and undue reliance should not be placed on them. There can be no assurance that forward-looking statements will prove to be accurate, and actual results and future events could differ materially from those anticipated in such statements. The information does not represent legal, tax, accounting, or investment advice; recipients should consult their respective advisors regarding such matters. Certain information herein is based on third-party sources believed to be reliable, but which have not been independently verified. Past performance is not a guarantee or indicator of future results; inherent in any investment is the risk of loss.


The Business Owner’s Exit: What to Know Before You Sell
Selling a closely held business is rarely just a transaction. For many owners, it represents…
Read More